Mathieu Boiret and Yves-Michel Ginot
Technologie Servier, Orléans, France. E-mail: [email protected]
Introduction
In recent years, counterfeit detection of drug products has become an important activity within the pharmaceutical field. It constitutes a major public health challenge and has become a priority as the lives of an increasing number of customers are endangered.1
The World Health Organisation (WHO) defined a counterfeit drug as: A counterfeit medicine is one which is deliberately and fraudulently mislabelled with respect to identity and/or source. Counterfeiting can apply to both branded and generic products and counterfeit products may include products with the correct ingredients or with the wrong ingredients, without active ingredients, with insufficient active ingredients or with fake packaging.2
Over the last few decades, several techniques have been used to detect counterfeit pharmaceutical tablets. Traditionally, chromatographic methods were chosen to analyse suspicious tablets.3 However, those chemical analyses are time consuming, destructive and require solvents. These constraints justify the increased use of other, quicker methods for counterfeit detection. Mass spectrometry and nuclear magnetic resonance have been tested4 by comparing suspicious and reference tablets but, in the main, the destruction of the sample was considered as an important drawback with these techniques. Mid-infrared spectroscopy,5 near infrared (NIR) spectroscopy6 or NIR chemical imaging (NIR-CI)7 have become particularly popular, as they are fast and non-destructive methods. However, these vibrational spectroscopy techniques usually require additional uses of a multivariate data analysis (chemometric) approach due to the complexity of their data.
Raman spectroscopy is also a vibrational spectroscopy technique, with the spectra usually giving rise to sharp and well-resolved bands. Peaks may be correlated with chemical constituents of a tablet [active pharmaceutical ingredient (API) and excipients]. Usually, the spectral analysis is easier and quicker than for NIR data analysis.8
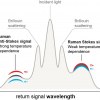
Transmission Raman spectroscopy allows non-invasive measurement of the bulk content of a tablet. It can be considered to be a special case of spatially offset Raman spectroscopy (SORS), for which a back-scattering geometry is utilised, where a laser excites the sample and the Raman signal is collected at both the excitation point and at a spatially offset distance; the scaled difference spectrum of these is then used to generate a spectrum of sub-surface components. In the transmission Raman spectroscopy concept, the laser beam and the Raman collection zone are separated to the extreme, both being on opposite sides of the sample.9 In terms of bulk analysis of tablets, this special configuration is a real advantage compared with conventional Raman spectroscopy, as the sub-sampling problem, which is often an issue due to heterogeneity of the tablet or surface coatings, is limited.
As a consequence, this spectroscopic measurement has become a useful tool for counterfeit detection, as the analysis is fast, non-destructive and provides information about chemical formulation of the entire tablet (core and coating).
During the study reported in this article, 18 Diamicron 80 mg tablets were analysed with transmission Raman spectroscopy. The aim of this study was to discriminate counterfeit tablets and to quickly evaluate the use of transmission Raman spectroscopy for counterfeit detection of tablets.
Materials and methods
Transmission Raman spectra were recorded using a dispersive Raman spectrometer (TRS100, Cobalt Light Systems, UK). An excitation NIR laser operating at 830 nm was used and focused onto the bottom surface of a tablet; transmitted radiation was collected from the top surface of the sample (see Figure 1). Laser power was approximately 0.65 W; the exposure time was 5 s.

Seven genuine 80 mg Diamicron tablets from Les Laboratoires Servier and 11 suspicious 80 mg Diamicron tablets from different seizures were used to perform this analysis.
Results and discussion
Figure 2 is a picture of one genuine tablet and one suspicious tablet. The seized tablets were formulated with the same shape, the same size and the same colour as the genuine tablets, which make difficult the visual identification of a counterfeit tablet. Moreover, it is important to specify that the packaging (including blisters and notices) of the genuine and the counterfeit samples were identical.
 and a counterfeit tablet (right).")
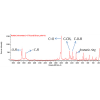
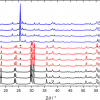
Raman spectral information, provided by the bulk analysis of each tablet, is shown in Figure 3(a). The differences between the genuine and the counterfeit tablets were easily observed without using a complex multivariate data analysis (here only a simple baseline correction was applied to the spectra). For example, as shown in Figure 3(b), the band at 1420 cm–1 is not visible in the counterfeit tablet Raman spectra.
 and genuine tablets (red). (a, left) Raman spectra over the range 1700–200 cm–1 and (b, right) scale-expanded view of the Raman spectra.")
However, to confirm the visual identification of counterfeit tablets, a fast and non-complex qualitative multivariate classification analysis was performed on the data. Spectra were first pre-processed by using an asymmetric least squares algorithm,10 followed by standard normal variate (SNV) on reduced spectra (from 200 cm–1 to 1800 cm–1). Kmeans analysis was used to explore the data. Kmeans is a cluster analysis which aims to partition a population of samples into different clusters. Each sample belongs to the cluster with the nearest mean. This analysis, which can be used without a calibration step, confirmed the results obtained by simple spectral comparison analysis.
Figure 4 shows the results of the Kmeans analysis. Two classes were clearly identified. The first class consists of the counterfeit tablets and the second class consists of the genuine tablets. Note that the variability within the first class of counterfeit tablets is important while the distance value between each genuine tablet is low. This can easily be explained by studying the tablet formulation. The genuine tablets were manufactured at Servier’s manufacturing site with a defined protocol, while counterfeit tablets were purchased at different locations, probably from several counterfeit manufacturers.
 and genuine population (red).")
Conclusions
Transmission Raman spectroscopy is a very useful tool for fast and non-destructive counterfeit detection of pharmaceutical tablets. While conventional Raman spectroscopy focuses the analysis on the surface of a tablet, transmission Raman provides information about the entire tablet, which means that the counterfeit detection can be carried out more easily if something is different within the coating or within the core of a genuine and a counterfeit tablet. Compared with NIR spectroscopic data, Raman spectra can be interpreted visually and more easily by the user. However, in the case of good quality counterfeit tablets, a multivariate data analysis approach can easily be developed.
Acknowledgement
The authors thank the Cobalt Light Systems Company for technical assistance and support during this study.
References
- I. Storme-Paris, H. Rebiere, M. Matoga, C. Civade, P.-A. Bonnet, M.H. Tissier and P. Chaminade, “Challenging near infrared spectroscopy discriminating ability for counterfeit pharmaceuticals detection”, Anal. Chim. Acta 658, 163–174 (2010). doi: 10.1016/j.aca.2009.11.005
- WHO, Counterfeit Drugs: Guidelines for the Development of Measures to Combat Counterfeit Drugs. WHO, Geneva, Switzerland (1999).
- M.C. Gaudiano, E. Antoniella, P. Bertocchi and L. Valvo, “Development and validation of a reversed-phase LC method for analysing potentially counterfeit antimalarial medicines”, J. Pharm. Biomed. Anal. 42, 132–135 (2006). doi: 10.1016/j.jpba.2006.01.059
- U. Holzgrabe and M. Malet-Martino, “Analytical challenges in drug counterfeiting and falsification—The NMR approach”, J. Pharm. Biomed. Anal. 55, 679–687 (2011). doi: 10.1016/j.jpba.2010.12.017
- P.-Y. Sacré, E. Deconinck, T. De Beer, P. Courselle, R. Vancauwenberghe, P. Chiap, J. Crommen and J.O. De Beer, “Comparison and combination of spectroscopic techniques for the detection of counterfeit medicines”, J. Pharm. Biomed. Anal. 53, 445–453 (2010). doi: 10.1016/j.jpba.2010.05.012
- M.M. Said, S. Gibbons, A.C. Moffat and M. Zloh, “Near-infrared spectroscopy (NIRS) and chemometric analysis of Malaysian and UK paracetamol tablets: A spectral database study”, Int. J. Pharm. 415, 102–109 (2011). doi: 10.1016/j.ijpharm.2011.05.057
- M.B. Lopes, J.C. Wolff, J.M. Bioucas-Dias and M.A.T. Figueiredo, “Determination of the composition of counterfeit Heptodin tablets by near infrared chemical imaging and classical least squares estimation”, Anal. Chim. Acta 641, 46–51 (2009). doi: 10.1016/j.aca.2009.03.034
- N.L. Jestel, in Process Analytical Technology: Spectroscopic Tools and Implementation Strategies for the Chemical and Pharmaceutical Industries, Ed by K.A. Bakeev. Blackwell Publishing, Oxford, UK, pp. 133–169 (2005).
- K. Buckley and P. Matousek, “Recent advances in the application of transmission Raman spectroscopy to pharmaceutical analysis”, J. Pharm. Biomed. Anal. 55, 645–652 (2011). doi: 10.1016/j.jpba.2010.10.029
- P. Eilers, “Parametric time warping”, Anal. Chem. 76, 404–411 (2004). doi: 10.1021/ac034800e