Mariana Monteiro,a,b Filipa Chasqueiraa,c and Sofia Pessanhaa,b,*
aLaboratory of Instrumentation, Biomedical Engineering and Radiation Physics (LIB-Phys), FCT, NOVA University of Lisbon, 2829-516 Caparica, Portugal
bPhysics Department, Faculty of Sciences and Technology, FCT, NOVA University of Lisbon, 2829-516 Caparica, Portugal. E-mail: [email protected]
cFaculty of Dentistry, University of Lisbon, 1649-003 Lisboa, Portugal
In this work we demonstrate the suitability of confocal Raman microscopy for the characterisation of carious dental tissues. Samples of enamel and dentine, presenting carious lesions in different stages of progression, were evaluated by comparing the depolarisation ratio of the PO43– symmetric stretching band at 959 cm–1 in the different tissues. Both line and area scans were performed to gauge these variations. Moreover, the obtained results were compared with the tissues’ behaviour when interacting with ultraviolet radiation, namely the induced fluorescence in some tissues. The depolarisation ratio has proven to be a valuable tool in recognition of demineralisation of both enamel and dentine due to caries. The analyses of the collagen bands in the dentine sample turned out to be more difficult to evaluate due to high fluorescence in the carious region.
Introduction
Most of us will, unfortunately experienced dental caries. These are caused by the release of acids (including lactic, acetic, formic and propionic) from bacterial metabolism diffusing into teeth and dissolving the mineral content of the dental tissues. This mineral is a carbonated hydroxyapatite with a complex crystal structure and containing defects, which is easily dissolved in acid.1 The effect of acid starts demineralisation of the tooth at the atomic level on the crystal surface inside the enamel or dentine, and can continue until it produces a cavity. Fortunately, saliva in the mouth has a high buffer capacity and supersaturated composition in phosphate and calcium, which minimises the effect of acids.2
Damage to teeth from acid can be reversed in the early stages, before a cavity has formed, through remineralisation. This natural repair process relies on calcium and phosphate ions assisted by fluoride to rebuild a new tooth surface on crystal remaining in subsurface lesions after demineralisation. These remineralised crystals are acid resistant and are much less soluble than the original mineral.1
Two layers can be distinguished in a carious lesion in dentine: a superficial infected layer and another, deeper, affected layer. The first is completely demineralised and its collagen proteins are irreversibly denatured. The deeper layer is not infected by bacteria, has no denaturation of the collagen fibrils and is just partially demineralised, and is thus more ikely to undergo a remineralisation process. The removal of the infected and necrotic layer, and the maintenance of the affected layer as a substrate for a restorative procedure leads to less traumatic treatment, removing less tissue and leaving a thicker dentine layer between the restoration and the pulp tissue.3
It is increasingly important to recognise carious lesions in their early stages before cavitation occurs, while the process of mineral loss is still reversible or at least can be arrested. When more invasive treatment needs to be undertaken, the dentist will remove the infected tissue and fill the cavity with restorative material. Therefore, the identification and differentiation of infected/affected tissue is of great importance in a conservative approach, to guarantee that no further tissue than necessary is removed. Raman spectroscopy is an established spectroscopic technique in the evaluation of enamel’s chemical composition modification due to demineralising agents such as acidic beverages4 and whitening products, either used accordingly to the manufacturer’s instructions5 or in an abusive manner.6 The analysis of the PO43– symmetric stretching band at ~959 cm–1 and its polarisation anisotropy have also been shown to be sensitive markers of demineralisation, namely of early caries detection.7 In this article we will demonstrate the suitability of Raman spectroscopy for the recognition and characterisation of carious dental tissue, namely, white spot lesions on enamel and carious dentine with different stages of progression, in order to differentiate between infected and affected tissue. The results will be compared with another emerging diagnostic technique in dental practice, illumination with ultraviolet (UV) light.
Materials and methods
Specimen preparation
Six human molar teeth, extracted for periodontal or orthodontic reasons and stored in an aqueous solution of 0.4 % chloramine, were selected by an expert and the inclusion criteria would be the presence of lesions, cavitated or not, including white spots. The teeth were cut in halves, perpendicularly to the occlusal surface, and the exposed surface was prepared for analysis by grinding with 1200- and 2500-grit SiC paper (Buehler, ref 30-5218-012 and 30-5218-025, respectively, Struers, Copenhagen, Denmark) under water refrigeration, and polished with a polycrystalline 1-µm diamond paste in a felt cloth. Between interventions, samples were sonicated for 1 min.
Confocal Raman microscope
Raman spectra of samples were obtained using a Horiba XploRA confocal microscope using a near infrared laser (785 nm) with a 1200 lines mm–1 grating. The spectral range investigated was from 300 cm–1 to 2200 cm–1 with spectral resolution of 4 cm–1. Using an entrance slit of 100 µm and a confocal hole of 300 µm, the scattered light collected by the objective was dispersed onto the air-cooled charge coupled detector (CCD) array of an Andor iDus detector. Both 100× (N.A. = 0.9) and 10× (N.A. = 0.45) objectives were used as well as a 50 % neutral density filter rendering a maximum incident power on the sample of 9.0 ± 0.4 mW (lasercheck®, Edmund Optics). Typical acquisition time for spot analysis was 15 s with 10 accumulations. Grids were constructed for line and area scans according to the region to be analysed.
In order to determine the depolarisation ratio (r) of the most intense band in the Raman spectrum, assigned to the symmetric stretching band of phosphate ions (~959 cm–1), in each spot, spectra were recorded in two orthogonal polarisations of scattered light (perpendicular and parallel to the polarisation of the incident laser). The r960 was then determined according to Reference 7:
Digital microscope with UV light
Images were acquired under UV illumination using the portable digital microscope AM4013-FVW DinoLite up to 215× magnification and UV LED light of 365 nm.
Results and discussion
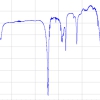
Figures 1a and 1b present the combination of parallel-polarised and cross-polarised Raman spectra of sound and carious enamel, without background correction. As can be observed, the phosphate symmetric stretching band at 959 cm–1 drastically decreases in sound enamel, while in the carious spectrum, this decrease is not so evident due to a structural modification of the enamel and loss of anisotropy. Moreover, there is also an increase of the background in spectra of carious enamel due to fluorescence. Similar behaviour is seen when analysing carious dentine, with a significant increase of background in the Raman spectra as we collect spectra from sound dentine into denaturated dentine (represented by the arrow in Figure 2c). After background correction of the same spectra (Figure 1d) it is possible to observe the bands at 1240 cm–1 and 1270 cm–1 corresponding to the deformation bands of the amide III group, the bands from 1300 cm–1 to 1400 cm–1 from the methylene group or the band at ~1660 cm–1 corresponding to the C=C stretching mode, together with the bands corresponding to phosphate vibrational modes. As can be seen, the symmetric stretching band at 959 cm–1 decreases concomitantly with the decrease of signal-to-background ratio of collagen bands, almost impossible to deconvolute near the cavitated dentine.

Figure 1. Raman spectra obtained for a) sound enamel with parallel and cross-polarisation; b) carious enamel with parallel and cross-polarisation; c) comparison of spectra obtained in sound through carious dentine without background correction and d) comparison of spectra obtained in sound through carious dentine after background correction.
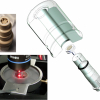
Figure 2 shows the images obtained with the digital microscope with and without UV light for four of the analysed samples (samples 1–3 and 5). Regarding Figure 2a, a typical “white spot” lesion is clearly visible in the enamel. This type of incipient lesion is considered to be the initial stage of evolution of a carious lesion. Ultraviolet irradiation of the same sample (Figure 2b) shows two different behaviours. On the one hand we have the bluish/green fluorescence induced in the collagen proteins of dentine; on the other hand, under ultraviolet light, enamel with white spot lesions is darker compared to the adjacent luminescent sound enamel. Similar results were obtained by Walsh et al.8 when studying dental biofilms and caries under different UV wavelengths. Regarding Figure 2c corresponding to a carious lesion in a more advanced stage of progression, reaching well into the dentine and resulting in cavitation and detachment of the amelodentinal junction, we can see distinguish three events. There is the healthy dentine with bluish fluorescence, but there is also a region where the UV radiation is completely absorbed in the dentine suggesting complete denaturation of collagen, and another region, more opaque without the fluorescence of collagen, suggesting some alteration of these proteins, but possibly recoverable.

Figure 2. Comparison of the images obtained with digital microscope with and without UV illumination for four of the studied samples.
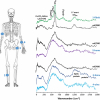
Regarding Raman analysis of the samples, line scans were performed in order to gauge the demineralisation stages of the enamel and non-cavitated dentine. Figures 3a and 3b show the variation of the depolarisation ratio obtained for the lines depicted in Figures 2f and 2h, respectively.
As can be observed, in sound enamel the depolarisation ratio is ~0.05, while there is a significant increase of the depolarisation ratio in the areas that correspond to the white spot lesions. Moreover, it was determined that in the region nearer to the surface of the tooth, the depolarisation ratio is very low (Figure 3b) which could be related with the contact of these tissues with saliva and, therefore, superficial remineralisation. Area scans were also performed, although these are very time consuming and more prone to defocusing during acquisitions. Similar behaviour was observed in the area scans obtained for samples 4 and 6, with higher depolarisation ratio in the carious lesion region.
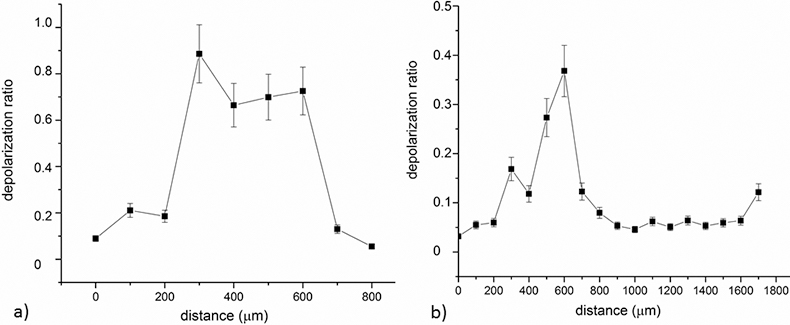
Figure 3. Plot of the depolarisation ratio obtained in line scans of two of the studied samples.
Conclusion
With this work we have demonstrated the suitability of Raman spectroscopy, namely by means of the depolarisation ratio of the symmetric stretching of the phosphate band, as a powerful tool for carious detection even in early stages. Mappings proved very useful in the delimitation of carious tissues, however, the analysis of a representative area is very time consuming considering that the areas should be scanned twice with different polarisations, and if the area is too big there is a greater risk of defocusing. This way, we should find a good compromise between time of acquisition for good signal-to-noise ratio and the dimensions of the XY array. Moreover, the area to be sampled should also be completely plane or a setup with an automated Z-axis should be used.

Figure 4. Plot of the depolarisation ratio obtained in are scans of two of the studied samples in 2D and 3D. Image obtained in the Raman microscope is represented for guidance.
The fluorescence induced by illumination with UV radiation also proved a versatile tool for the rapid recognition and delineation of demineralised tissue, as well as showing promise for differentiation between infected and affected dentine. With Raman analysis, on the other hand, it was more difficult to evaluate the denaturation of the collagen bands due to the low signal of the bands and the high fluorescence of the spectra in the carious region.
Acknowledgements
Financial support for this investigation was provided by Portuguese Foundation for Science and Technology (FCT) in the funding of LIBPhys-UNL (project-UID/FIS/04559/2013). S. Pessanha also acknowledges FCT for the post-doc grant SFRH/BPD/94234/2013.
References
- J.D.B. Featherstone, “Dental caries: a dynamic disease process”, Aust. Dent. J. 53, 286–291 (2008). doi: https://doi.org/10.1111/j.1834-7819.2008.00064.x
- M.J. Larsen and C. Bruun, Enamel/Saliva—Inorganic Chemical Reactions. Munksgaard, Copenhagen (1986).
- M. Nakajima, S. Kunawarote, T. Prasansuttiporn and J. Tagami, “Bonding to caries-affected dentin”, Jpn. Dent. Sci. Rev. 47, 102–114 (2011). doi: https://doi.org/10.1016/j.jdsr.2011.03.002
- Microsc. Res. Tech. 74, 1083–1087 (2011). doi: https://doi.org/10.1002/jemt.20998
- J. Silveira, S. Coutinho, D. Marques, J. Castro, A. Mata, M.L. Carvalho and S. Pessanha, “Raman spectroscopy analysis of dental enamel treated with whitening product—Influence of saliva in the remineralization”, Spectrochim. Acta A 198, 145–149 (2018). doi: https://doi.org/10.1016/j.saa.2018.03.007
- J. Castro, J. Godinho, A. Mata, J.M. Silveira and S. Pessanha, “Study of the effects of unsupervised over-the counter whitening products on dental enamel using micro-Raman and micro-EDXRF spectroscopies”, J. Raman Spectrosc. 47, 444–448 (2016). doi: https://doi.org/10.1364/OPEX.14.000203
- L.J. Walsh and F. Shakibaie, “Ultraviolet-induced fluorescence: shedding new light on dental biofilms and dental caries”, Aus. Dent. Pract. 18, 56–60 (2007).