David Honigsa,* and Gary E. Ritchieb
aField Application Scientist, PerkinElmer Inc.
bConsultant, Senior Systems Lead, Joyson Safety Systems
DOI: https://doi.org/10.1255/sew.2022.a13
© 2022 The Authors
Published under a Creative Commons BY licence
This column has invited two world-renowned experts in near infrared (NIR) spectroscopy to let the world benefit from decades of leading-edge experience, especially regarding sampling for quantitative NIR analysis. Our colleagues jumped at the opportunity with a didactic exposé of issues to consider before a NIR analytical result can be declared valid. Two very practical examples shed a penetrating light on the interconnectedness of analytical technology sensa stricto and the use of the final analytical results. And not only that, the reader is also invited to a brief tour of the Bayesian statistical world view along the way …—Kim H. Esbensen (Editor)
Introduction
“All that and a bag of chips”. It’s a common enough saying, but things get messy real fast if you just try to sample a bag of chips/crisps. There are several fundamental issues that formally jump at your throat. First of all, based on the Theory of Sampling (TOS), there is the “Fundamental Sampling Principle (FSP)”, which compels us: “All virtual increments in any lot must be susceptible to sampling and must have the same probability of ending up in the final composite sample”.1 This means that a NIR analyst must start with the opening assumption that everything in the original lot (every component) has had an equal probability of being selected to appear in the “sample” delivered to the analytical laboratory (and in the correct proportions too). That’s sort of reminiscent of how the statistician Bayes developed his famous probability theory world view: “In the absence of knowledge, everything is equally probable”. But then “knowledge” starts to show up and it kicks us, and our equal probabilities, in the teeth. Let’s follow how this happens.
Critical issues to consider
We’ve all had a bag of crisps or chips in our hands. And we have all probably noted that the crumbs in the bottom of the bag are different from the intact chips. They are oilier, have more salt and more seasoning, and are definitely harder to pick up, i.e. they possess an inherent reluctance towards sampling. Right here at the outset this doesn’t bode well, since we are mandated (FSP) to have equal probability of picking up components. But with dramatically unequal sizes and physical properties it is quite challenging to pick them with equal likelihood; how is it possible to do this in the correct proportions?
And equal probability based on what criterion? Equal based on volume or mass? That depends on what you want to know. Do you want to know the analysis of the average chip experience, or do you want to know the analysis of what is in the package for nutritional labelling say? By volume or by weight? Where did all these questions come from?
The questions come from the fact that a little knowledge changes our equal probability assumption irrevocably, just like a bit of knowledge changes Bayesian prior probabilities. So, let’s settle this question by focusing on mass. We want equal probability by mass. What do we do next?
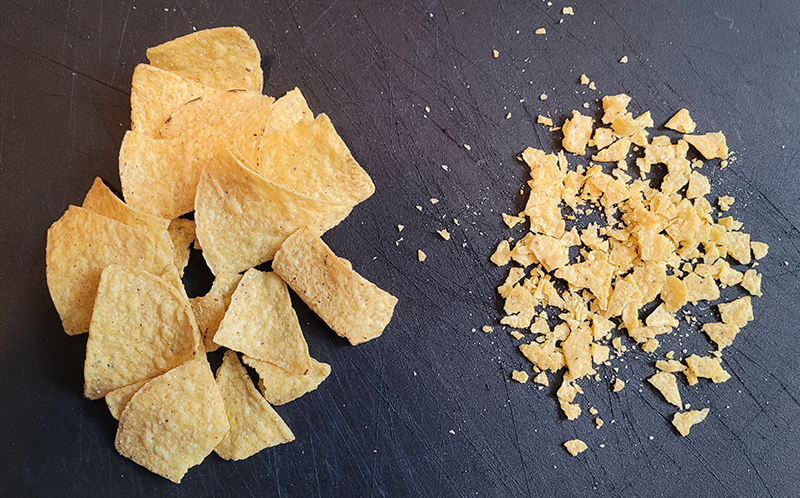
Figure 1. There are chips—and there are chip fragments “all the way down the grain size scale” … Photo: Kim H. Esbensen
We can reduce everything to the same particle size and try to randomly select from that. This sounds straight out of the TOS’ playbook, but there is a serious catch: for what common particle size do we aim with a comminution operation? Push the size of the resulting ensemble of ground-down particles far enough, and you’d, for example, be left with a single grain of salt, which cannot ever be representative of the whole bag. We can easily reach a particle, and a sample size, which is simply too small to represent the whole (bag). Well then, we can reduce everything down to the smallest particle size, and mix this state thoroughly and then select a high enough number of them so that the probability of having a nonsensical event like a salt crystal doesn’t change the overall result. Some would say randomise all the ground-down particles, but we must be aware that a fully homogenous end-state for poly-component mixtures does not exist—there will always be a residual, non-compressible heterogeneity.1
Or, we can stratify our approach. We can separate the sample into the large chips vs the crumbs. We can easily weigh these two groups—and sample and analyse these two groups separately, and then balance the two analytical results by their correct mass fractions to get back to equal probability. Stratifying the material based on our knowledge that smaller pieces have more surface area and pick up more oil and that the seasoning falls off and resides in the small pieces preferentially makes it an easier problem. It might perhaps seem counter-intuitive, but breaking the problem into parts, analysing the parts and then putting it all back together appropriately weighted, is actually more accurate in many cases. Why? Because we are again working from a knowledge base, and we use that knowledge to change the problem definition. “Random selection” works when you don’t know things, but peek while you are doing that so-called random selection, and your pesky brain changes your operative performance and, therefore, also your results.
Regardless, now our bag of chips is separated into two piles, the larger original pieces and the crumbs. We have the comparison weights. Now how big should the sub-samples (increments) be and how many? How big a.o. depends on the reference analytical technique as every analyst know, but it also depends on the material characteristics of the material you are sampling, and this is one of the core issues that we have the TOS to helps us resolve.1
Some provocative thoughts: all for the good cause
How many increments is an easier question to answer. What follows is deliberately a bit provocative, but it serves the purpose well: The principal answer to how many is three. What? How come “three”? Because three is the minimum number of data to be able to estimate a standard deviation. One result gives you a mean. Two gives you a difference. Three is the minimum for getting to an estimate of a standard deviation. We can of course, and often should, involve a higher number of results—but while we can get more and more measurements, their individual impact on improving the mean goes down. Improving our knowledge for the least amount of work peaks at three. With three we have a rough idea of how consistent or inconsistent our equal probability increments are and can begin to figure out how many we really need to get our uncertainty down to where we would like it to be. All the while we do this, it is imperative to know how to extract increments in an unbiased fashion—this is where the TOS comes in with fatal consequences for those who have not vested a minimum effort in getting to this competence level.1
So, three gets us the first knowledge with which to figure out how many we really need, again based on our desired precision. So, with three increments of the chips (you may call these “sub-samples” if you like, but you are blurring the precise terminology recommended in the TOS) and three of the crumbs and their results, we can make an educated guess with error bars and the whole shebang of the likely content of the whole bag of chips. Six increments, sub-samples, as a minimum will get us started (yes, many would insist on a higher number of observations, but that’s another story).
So, what do most people do in practice? Well, lots of times they throw the whole bag into a Cuisinart food processor, “mix well” and then proceed to take one sample of the ground-down mixture and go from there. And they are fortunate in their ignorance. Because if they had worked in pharmaceuticals, for example, and learned about mixing and unmixing, component density and the like, they would not be anywhere as confident that they had analysed a representative sample. Knowing things again changes the rules and the probabilities.
The above example helps us to understand how the TOS can be used to logically and systematically think through how to use the NIR spectroscopy analytical powerhouse correctly—to improve the accuracy and precision of the analytical result. The realm of “before analysis” is a critical success factor for representative and, therefore, reliable analysis, a realm that always must be reckoned with.1–3
TOS basics
Besides the first fundamental principle of the TOS, FSP, there are five more governing principles that have a bearing on how suitable for their intended use your NIR measurements will be. The most important of these, together with a few salient focus issues are:1,4–6
- Lot dimensionality: Defined as the number of effective dimensions that need to be covered by the sampling process. The TOS shows how there are overwhelming advantages in sampling from elongated 1-D lots, most often in the form of moving 1-D lots (process sampling).
- Sampling Invariance: Refers to the fact that all materials are made up of “constituent units” pertaining to three scales, e.g. starting from the absolutely smallest scale:7
- Atoms and molecules. While this scale level is generally not of interest for the macroscopic sampling normally occurring in technology, industry and society, this is central to NIR analysis (see Reference 2 for details).
- The critical scale level commensurate with the sampling tool volume, defined as the sampling increment, in which the constituent units can be grains, particles, fragments thereof, as well as aggregations, particle clumps a.o., coherent enough so as not to be fragmented in the sampling process).
- The largest scale of interest is the observation scale of the sampling target itself, the lot scale.
- Sampling Correctness (bias-free sampling): The TOS uses this term to denote that all necessary efforts have been executed which has resulted in successful elimination of the so-called “bias-generating errors”, a.k.a. the Incorrect Sampling Errors (ISE).4
- Sampling Simplicity (primary sampling + mass-reduction): This principle specifies the multistage nature of all sampling processes, stating that there is always a primary operation, followed by a series of representative mass reductions (sub-sampling or splitting operations) until a representative analytical aliquot has been produced.2 This principle allows all stakeholders to optimise the individual sampling and analytical stages independently of each other.
- Heterogeneity Characterisation: Heterogeneity is attributed as the primary source for effects from the two so-called “correct sampling errors”, and a specific sampling process may itself result in effects from up to three additional ISEs.1,5,6
Specifics of NIR analysis
In performing NIR experiments, the first non-negotiable criterion is that the sample to be analysed must be representative of the target material from which it has been extracted. It makes no sense to analyse a sample (aliquot) that cannot be documented to be representative of the whole lot from which it originates.1
Ritchie presents the Analytical Method Triangle for the modern NIR experiment, which takes into account sample Design of Experiment (DoE),8 Figure 2.
NIR characteristics can be visualised as three legs of a triangle:
- Instrument Qualification
- Method Validation
- Sample DoE
… with a fourth component being analyst knowledge (education, qualification and training). Meeting the regulatory requirements for an analytical method requires that critical parameters for instrument and method performance be evaluated. Similarly, samples must be evaluated for their appropriate properties and response for NIR measurements, e.g. that they have been sufficiently “homogenised” a.o.
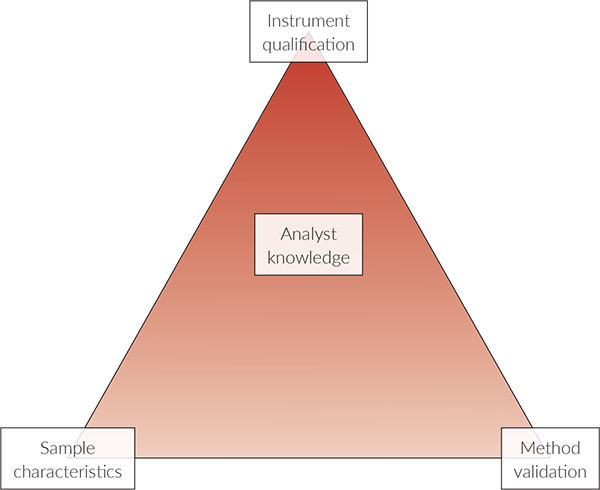
Figure 2. Analytical Method Triangle; see text for explanation.
The NIR measurement is unlike most other analytical determinations for several reasons.3 Because NIR analytical results are based on a correlation of spectra to reference values determined from a valid reference method which is sensitive, specific and selective for the analyte, NIR measurements are indirect measurements. As a result, NIR measurement errors arise primarily from calibrations based on the NIR measurements plus the laboratory values obtained from the reference method.9,10 The sample carries with it two major sources of error—in addition to the various sampling errors governed by compliance, or rather by non-compliance with the representativity demands from the TOS. The total combined error contributes to the bias (difference) observed between the calibrated NIR and compendial reference methods. Also, NIR measurement spectra carry with them three qualities that reflect the effective degree of heterogeneity of a sample:
- The physical dimensions of the sample itself, expressed as particle size, due to diffuse scattering energy interacting with the sample material and the nature of diffuse reflectance interacting with the detector. Differences in the physical composition of the sample lead to scattering of non-absorbers which interfere with the absorption spectrum of the analyte of interest.
- The chemical composition of the sample as a result of the overtones and combination vibrations of molecules, lead to absorptions in the NIR portion of the electromagnetic spectrum. Contaminated absorption spectra will arise from a heterogenous sample outside the specifications for the sample under study and will, therefore, lead to erroneous results.
- The NIR measurement and the samples temporal and spatial positioning while spectra are being acquired and whether the sample is static or moving also has a definite effect on the final spectra.
While the heterogeneous nature of a material in a specific comminution state is scale invariant, the physical, chemical compositional and positional (spatial) characteristics for solids are magnified in material exhibiting NIR absorption and the heterogeneous nature of materials makes itself evident in the following ways:2
Non-absorbing components in the joint particle domain exhibit their effects as multiplicative and additive scatter. This is heterogeneity-exhibiting physical effects which leads to calibration and prediction error in the calibration model. Furthermore, heterogeneity contributes to sampling error due to compositional effects because particles in general may well be composed of different grades of the analyte in question, also contributing to the analytical error component of the model. In addition, samples that are moist or wet, will evaporate water and this will cause the spectra to appear to shift. Last, temperature will have a similar shifting effect on spectra if care is not taken in controlling the sampling of hot or cold samples. See more on these issues in measurement uncertainty in, e.g., References 2, 3 and 11.
As all NIR analytical techniques require that method validity, accuracy, precision and linearity through appropriate DoE have been demonstrated, the sampling processes involved before analysis should also be subject to a process akin to DoE that informs the analyst about the sources and magnitude of sample heterogeneity, and the sources of other sampling errors—all of which have to be counteracted by the universal procedure called composite sampling.1,2,4–7,11 In addition, samples being measured in a moving process should be studied using variographic analysis.1,2
All NIR experiments should be accompanied by an analytical sampling plan. The minimum requirement shall be that the total sampling error and the total analytical error have been successfully decomposed and individually quantified.1,2,6,11
In practice
Another example follows below that illustrates TOS principles as they apply to the modern NIR experiment.
This time, instead of sampling a bag of chips, let’s work through how you sample soymeal. The first major difference is that a trade association called the National Oilseed Processors Association (NOPA) exists, which has produced sampling guidelines for the industry. Better follows these, or else? This dictum will, of course, depend on whether these guidelines contribute towards representativity, or not.
What lot size are we sampling now? We are going to sample a truck, or a rail carload. How do we extract a sample from this “enormous” lot size? Well, this is a perfunctory example of the dictum: “Best to sample a moving stream of material, because this is a 1-D lot configuration” (see above)!
For example, as the soymeal is falling into the vehicle through a chute, a travelling sample cutter translates across the chute stream periodically. It’s a lot easier to sample the undisturbed material as it is being loaded into the vehicle than after it has deposited and segregated therein, which entails separating fines from the lighter fluffy particles big time (Figure 3). How big a sample do we need to extract? Well, most people will grab the NOPA guidelines recommended amount, and quickly store this amount in a NOPA bag approved for this application—et voila, job done! With this approach they would be following scores of colleagues who, unfortunately wrongly, operate from the question: “How big shall my sample be in order for it to be representative?” The assumptions behind this evergreen question have been thoroughly debunked, however, sample mass is not the driver for sample representativity. For readers of this column, it suffices to refer to References 1, 2, 4–7 and 11 for full explanation and documentation.
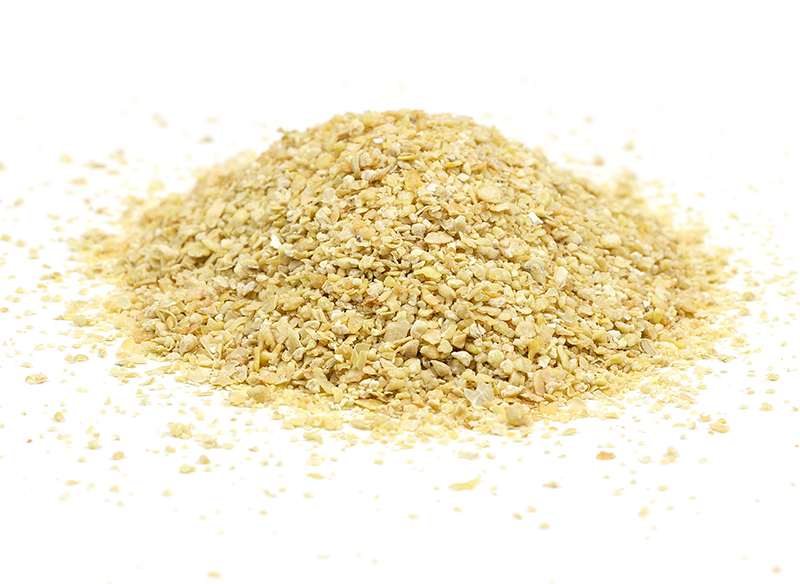
Figure 3. Particle size distribution in soymeal.
Where the money comes in
Why is sampling of the commodity soymeal so important that it has a solid description and procedure? Soymeal generally has a targeted, or contractually promised, protein content. You need to prove you’ve hit the specified protein minimum content. All the while you are busy complying with this demand, soybean meal also has a maximum allowed moisture level, so you also need to show you didn’t exceed that—or there is a 1 : 1 penalty. 1 % over the threshold moisture, and you get penalised 1 % of the price (plus that fraction of the shipping, if you have that in the contract as well). Finally, there is also fibre in soybean meal, mostly left from the hulls. Removing the hulls is clearly important because if you are leaving some in and try to sell hulls at soymeal prices—is not fair tradecraft. The penalty for excess fibre is not 1 : 1 for hulls, but a multiple. It soon gets very pricey to have too many hulls if/when you get caught. The hulls are very light and will separate to some degree while being transported and loaded/off-loaded, so correct sampling is ever so important!
Sampling evenly as the transportation vehicle is filling is very smart, because you’ll be safe in that the entire lot volume (the entire lot mass) will be available for your incremental sampling, and you will assuredly be able to produce a fit-for-purpose representative composite sample. However, a word of caution from the world of practice: the authors have seen dust bags that are being filled with airborne particles be cleaned by dumping this dust back onto the product. In one way this makes sense: this dust is a bona fide part of soybean meal, but if you were just grabbing a sample from the lot without thinking and happened to grab some of these dusty fines, your analytical validity would be off—because those fines, and the fines from the bag of chips, share something in common: they are assuredly not representative of the bulk composition. In soybean meal analysis, this thorny issue is solved by enforcing a random sampling over time, a scheme which no operator can mess with. No brains, no prior knowledge is involved, so the sampling can be truly random. This is one reason why studies are done double-blind, or you need to have iron-clad enforced procedures. Give someone time to think about how they are sampling things—and randomness is right out the window. Thinking TOS-correctly comes first, and later it is all just action, i.e. sampling.
How not to do it
The final step doesn’t have NOPA approval, and some people skip it. You have your NOPA bag and you now sally forth to your NIR instrument. But don’t just arbitrarily grab “enough” material to fill your aliquot cup and make a measurement. This would be the cardinal grab sampling sin,1,2,11 writ very small; but this is still grab sampling!
Instead extract three analytical aliquots; you are now replicating the analytical sampling + analysis three times. These three readings can be compared, and they carry a lot of information. From these few results you can figure out the estimated magnitude of this final stage NIR aliquot sampling variability and make sure it is in line with your a priori set precision threshold. See above regarding analytical three-ness and its importance. You’ll find a full description of the replication experiment, here executed for just three analytical results, in References 1–3: this is essential knowledge for analysts of any ilk, not only NIR.
NIR is not alone
Much can be learned by stepping outside the NIR domain. For example, concerning how to arrive at a reliable analytical result for complex lots of quite different size, composition and spatial heterogeneity, e.g. incinerator bottom ash (Figure 4), surely this is another issue all together. For one thing, bottom ash is a heavily segregated material and there is no way NIR analysis can do analytical justice to this kind of material [you’ll need X-ray fluorescence (XRF)]. Yet the pre-analysis issues are identical to those for a bag of chips, only more accentuated and at a different scale. Here, much more powerful crushing technologies are needed, but the necessary separation into size-classes is identical. The critical pre-analysis realm is treated in detail in References 1–3 and 11.
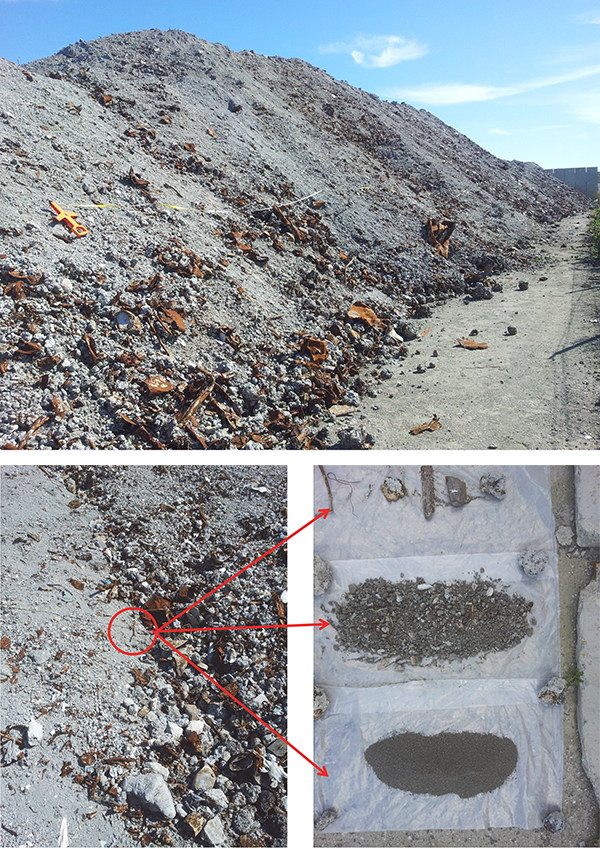
Figure 4. How to arrive at a reliable analytical result for a much more complex lot, e.g. incinerator bottom ash. A simple food processor comminution is not enough, much more powerful crushing technologies are needed, as well as another analytical technique (XRF), but the necessary separation into size-classes is identical to what is needed also for a bag of chips, even though the primary sampling step is clearly also critical. Photo credits: Center for Minerals and Materials (MIMA), GEUS (https://www.geus.dk).
The last word
In summary, Know about the critical “before analysis” sampling issues (TOS).
Then execute according to the plan developed5 (think no more).
Now analyse the aliquot you worked so hard to be representative; in fact, analyse three aliquots.
Be happy that you involved at least some sampling + analysis validation in your procedures.
And then go reward yourself for a job well done with a drink—and a bag of chips.
(You may also reward yourself by gorging on the plethora of relevant references below.)
Acknowledgement
We would like to give a huge thank you to the editor, Prof. Kim Esbensen for his invitation and guidance in preparing the manuscript for the Spectroscopy Europe/World Sampling column. A similar thank you to the co-editing Publisher.
References
- K.H. Esbensen, Introduction to the Theory and Practice of Sampling. IMP Open (2020). https://doi.org/10.1255/978-1-906715-29-8
- A. Ferreira, J.C. Menezes and M. Tobyn (Eds), Multivariate Analysis in the Pharmaceutical Industry. Academic Press (2018). https://doi.org/10.1016/C2016-0-00555-7
- W. Ciurczak, B. Igne, J. Workman, Jr and D.A. Burns (Eds), Handbook of Near-Infrared Analysis. CRC Press (2021). https://doi.org/10.1201/b22513
- K.H. Esbensen and C. Wagner, “Theory of sampling (TOS): fundamental definitions and concepts”, Spectrosc. Europe 27(1), 22–25 (2015). https://www.spectroscopyeurope.com/sampling/theory-sampling-tos-fundamental-definitions-and-concepts
- C. Wagner and K.H. Esbensen, “Theory of Sampling: four critical success factors before analysis”, J. AOAC Int. 98, 275–281 (2015). https://doi.org/10.5740/jaoacint.14-236
- DS-3077 Representative Sampling – Horizontal Standard, Danish Standards (2013). www.ds.dk
- K.H. Esbensen, Introduction to the Theory and Practice of Sampling. IMP Open, Ch. 3.5 “Scale”, p. 31 (2020). https://doi.org/10.1255/978-1-906715-29-8
- G.E. Ritchie, “How modern near-infrared came to be”, Contract Pharma Magazine (April 2021). https://www.contractpharma.com/issues/2021-04-01/view_features/how-modern-near-infrared-came-to-be/?widget=listSection
- R. Difoggio, “Examination of some misconceptions about near-infrared analysis”, Appl. Spectrosc. 49(1), 67–75 (1995). https://doi.org/10.0003702953963247
- R. Difoggio, “Guidelines for applying chemometrics to spectra: feasibility and error propagation”, Appl. Spectrosc. 54(3), 94A–113A (2000). https://doi.org/10.1366/0003702001949546
- K.H. Esbensen and C. Wagner, “Theory of sampling (TOS) versus measurement uncertainty (MU) – A call for integration”, TrAC Trends Anal. Chem. 57, 93–106 (2014). https://doi.org/10.1016/j.trac.2014.02.007

David Honigs
David Honigs, PhD, a PerkinElmer Field Applications Scientist specialising in Food, did his graduate work under joint supervision of Professor Gary Hieftje and Dr Tomas Hirschfeld at Indiana University, Bloomington. He served as an Assistant Professor of Analytical Chemistry at the University of Washington for a few years. Following that, he worked at NIRSystems (now part of FOSS) on NIR instruments. He started a company, Katrina Inc., producing process NIR instruments. For almost the last 20 years he has worked at Perten (now PerkinElmer) on Near Infrared Instrumentation and applications in the food industry. He has 35 research papers listed on ResearchGate.com and has 10 issued US patents.
[email protected]

Gary E. Ritchie
Gary E. Ritchie, MSc, is a Consultant, Senior Systems Lead, with Joyson Safety Systems. Gary received his Bachelor of Arts and a Master of Science in Biology from the University of Bridgeport, Bridgeport, Connecticut. He is an internationally recognised expert in pharmaceutical analysis with a focus on vibrational spectroscopy and multivariate analysis, process analytics and quality assurance. His experience includes increasing responsibilities in quality control, technical services, research and development and new technologies with Schein Pharmaceuticals and Purdue Pharma. Gary was appointed Scientific Fellow for Process Analytical Technology and Liaison to the General Chapters, Pharmaceutical Waters and Statistics Expert Committees from 2003 through 2008 for the United States Pharmacopeia (USP). Gary served as Director of Scientific Affairs, and currently consults for InfraTrac. He was director of Operations for Dynalabs for several years before retiring. Gary currently consults, providing analytical and quality solutions for the pharmaceutical industry and companies aligned with providing biomedical solutions. Mr Richie has published more than 25 peer reviewed papers and book chapter contributions, has numerous patents and industry journal articles, and has been invited to give conference and symposia presentations worldwide. He was President of The Council for Near-Infrared Spectroscopy (CNIRS) from 2012 to 2014 and now serves as its Newsletter Editor. He was chair to ASTM International (ASTMI) Committee E13 on Molecular Spectroscopy and for the International Diffuse Reflectance Conference (IDRC) in 2006.
[email protected]


