Werner Barnarda, Henk-Jan van Manena and Antony N. Daviesa,b
aExpert Capability Group – Measurement and Analytical Science, Nouryon (formerly AkzoNobel Specialty Chemicals), Deventer, the Netherlands
bSERC, Sustainable Environment Research Centre, Faculty of Computing, Engineering and Science, University of South Wales, UK
In recent months, we have promoted analytical spectroscopy at Open Days and at the biggest Chemistry conference in the Netherlands. At both events we were challenged to create demonstrations to inspire parents, teenagers as well as students and postgraduates into the world of industrial chemistry with a specific twist of process analytical technology (PAT). This article will show what we created and how the platform can be used for educating people and colleagues at many different levels of prior knowledge.
From health & safety to advanced chemometrics
The advantage of telling such a story is that the arguments for deploying process analytical spectroscopy are so compelling that they are easily understood by people with different levels of prior understanding. If you start by discussing removing people from the act of having to take samples from an active chemical manufacturing plant, the advantages are so simple to understand, from a health and safety perspective, as to be obvious to an audience with no technical training at all.
For audiences with a greater interest in the financial drivers, discussions around improving the manufacturing process by stopping at exactly the right moment for the best profit from a batch are easy to follow. As is obtaining a better understanding of the whole manufacturing process, so that you can adjust the manufacturing parameters as a run proceeds. Obviously better than discovering something was not quite right when the results from the final lab-based testing comes in. Such capabilities can also make an enormous contribution to the overall sustainability of chemical manufacturing and the reduction in waste.
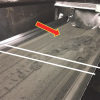
For those who like to talk, we can go on for hours, but for many of our visitors it is better to see equipment in action to understand some of the finer aspects of the work of our teams in this area. We put together a very simple demonstrator for our Open Days showing different near infrared (NIR) spectroscopic fibre probe types in a single reaction vessel (Figure 1). These types of probes are, of course, the pre-eminent workhorses in the PAT arsenal.
We chose three NIR optical probe configurations to exemplify some of the investigations that need to be made as part of a PAT deployment project.
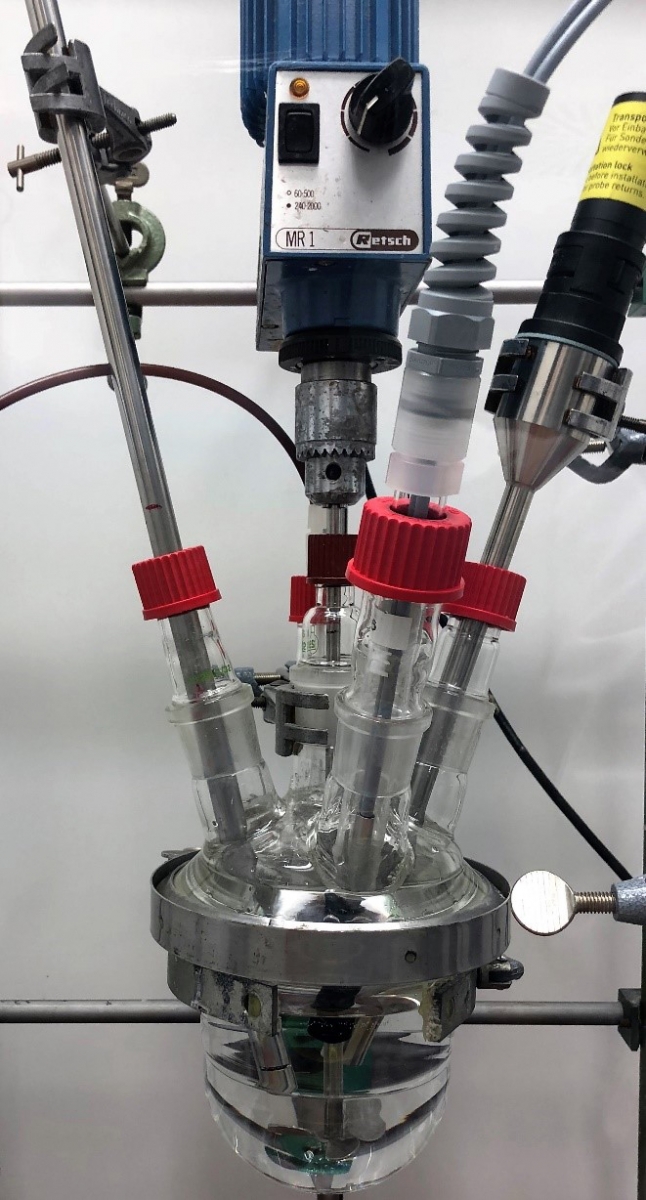
Figure 1. The setup used at the Open Days with the three probes inserted from above for simultaneous monitoring of the reagent being dosed from the rear port.
Running demonstrators
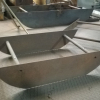
In both the Open Days and conference displays we chose to highlight the work of a scientist in a process analytical team through the example of different operational environments that require the selection of transmission, transflection or reflection probes to deliver the best analytical results (Figure 2).
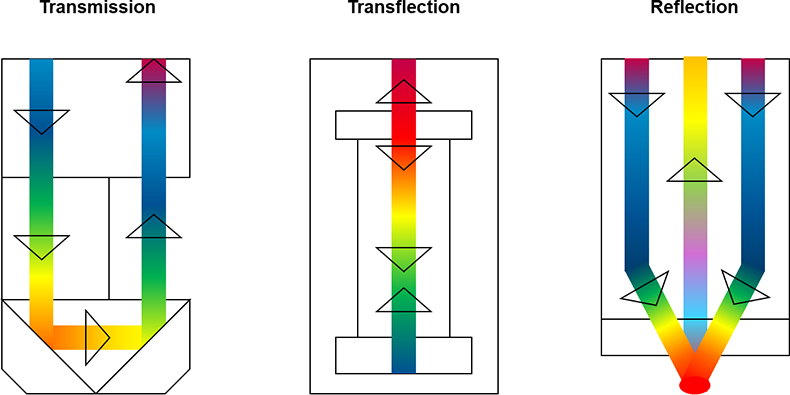
Figure 2. Three fundamentally different probe designs used during a selection process for different environments the probes may be exposed to.
Here, the team executed reaction monitoring experiments against three calibration models individually created for the different probe types where the monitoring “results” from each probe were displayed in real time on a single monitor system.
This experiment has the advantage that it is relatively simple to set up and dismantle after use, the chemometric models are quite stable for live demonstrations and the figures we show around the location of the display simple for all to understand.
Upgrading for exhibitions
Following the same theme, we have created a more complex version of this process analysis demonstrator for the Dutch chemists’ conference. Here the audience is generally at a much higher scientific level than during a normal open day and so a number of new additional features were introduced.
Instead of just running a dosing experiment, we introduced the concept of having to work with chemical processes where reactor contents are not just pure clear liquids but contain particles or crystallising products. This required a change to the “reactor vessel” with a bigger piece of glassware selected, which was deeper and also wider at the top to allow more ports to be built into the lid. The additional depth allowed the simulation to add complexity with the addition of solid particles. When the stirrer was switched on these particles span up into the body of the reactor and their effect on the different probe designs could be followed in real-time. These particles had to exhibit some very specific properties. To be able to repeat the demonstration multiple times per hour the particles needed to be heavy enough to settle quickly to the bottom of the reactor once the power to the stirrer was removed. The particles also had to be of a specific size to demonstrate interference with the process analytical measurement from certain probe designs.
With the increase in vessel size we were also now able to demonstrate the benefits of online analysis as opposed to the “inline” variants we had been showing in the open-day version. Using one of the extra ports in the reactor lid we could take a flow out of the reactor in bypass mode; this we equipped with a transmission NIR probe. Equipping the inlet with a filter meant we could show one of the strategies for continuing to use transmission probes even in environments where the particulates in the main flow or reactor means that in-line monitoring is impossible.
By building this demonstrator on a metal frame on wheels we were able to make transportation to the exhibition relatively simple. The size of the frame was specified that when not in use for exhibitions the frame will fit neatly into our normal process analysis floor to ceiling fume cupboards allowing it to be a useful resource in our day-to-day work. For the exhibition we were also able to take the bypass flow through two further glass condensers to simulate more complex separation and processing steps which gives a more balanced picture.
Explain the benefits of chemometrics
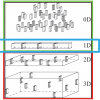
The chemometrics analysis is often difficult to explain briefly. However, one image the team generated brought the message of the power of chemometric data processing to extract information from the surrounding noise which we added to the presentation of the process analytical work (Figure 3). From a purist’s perspective, this does not necessarily show extracting data from impossible sets, but it does show analytical peak sizes people can relate to and depending on your particular audience you can discuss this figure at many different levels.
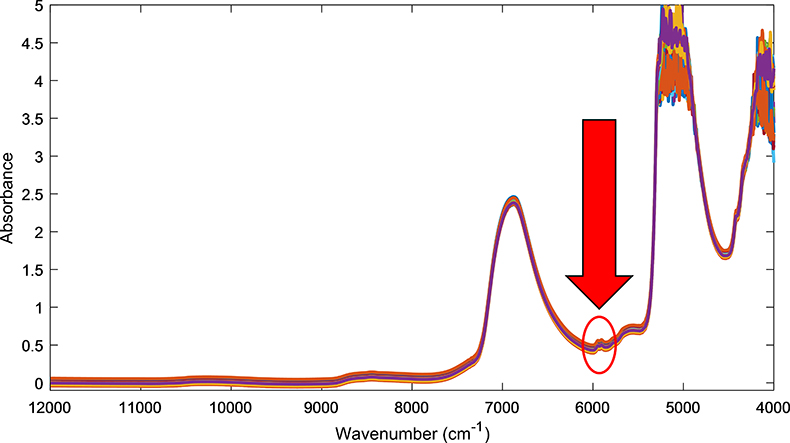
Figure 3. A simple example why chemometrics is required to find and measure the analyte needle in the spectroscopic haystack.
So, having preached in several recent columns about the need for better training and interaction of more advanced technologies to inspire our future generations, it was fun and educational to put this relatively simple setup together as model of probe selection for a PAT implementation project.
Acknowledgements
The authors would like to thank Thibaut Février, Herman Strijdveen as well as Rob Bloemenkamp, Kristiaan Klijnstra and Ali Ghamati for invaluable help and bright ideas in realizing this project.