Johannes Hesper
Shimadzu Europa GmbH, 47269 Duisburg, Germany
Nuts, bread crusts, toffee, apples—a hearty bite into food can be the trigger that breaks a tooth. However, the real reason may not be the food or contaminants or particles in it, but the tooth’s natural age, structure and chemical make-up, or even caries. In case of complaints, how can food producers trace what has happened and begin an analysis of the cause? It starts with the materials…
There are many different types of dental products and their characteristics vary according to their intended purpose. Examples include temporary dressings, dental restorations (fillings, crowns, bridges), endodontic products (used in root canal therapy), impression materials, prosthetic materials (dentures) or dental implants. They all differ from the natural substances of a tooth.
In order to analyse the substance of materials, Fourier transform infrared (FT-IR) spectroscopy and energy-dispersive x-ray fluorescence (ED-XRF) are the methods of choice. Here, we report the analysis of a human tooth and various dental restorative materials by an FT-IR spectroscopy instrument coupled to an FT-IR microscope for molecular analysis and an ED-XRF spectrometer for elemental analysis. Due to the diversity of dental materials, which include hybrid materials containing organic and inorganic components, metal materials and others, a combined analysis approach was chosen.
Dental materials
Dental materials, such as metals, porcelain, ceramics and composite resins, are used in restorations, for example to repair carious lesions or other defects on single teeth. Fillings may be necessary in both the crown part and the root part of a tooth. A classic example is the amalgam filling, which has been used for centuries.1
Fillings can break off the tooth completely or only in pieces, and they may then be found as supposedly unknown foreign bodies in food. In some cases, this contamination is wrongly perceived as food contamination and consumers send it to the food manufacturer, complaining that the contamination originates from the production process. This can be clarified quickly by a combined analysis with FT-IR and ED-XRF; the complementary nature of these techniques can identify the source of contamination unambiguously.
Measurement methods and instruments
ED-XRF is a method used in material analysis and is one of the most frequently used methods for the qualitative and quantitative determination of the elemental composition of a sample, since the samples are not destroyed by the measurement and no digestions are required. It is widely used in the metalworking industry, in the analysis of glass, ceramics and building materials, as well as in the analysis of lubricants and mineral oil products.
The detection limit of ED-XRF depends on the sample matrix and the element itself. It can reach ppm levels for most elements. Here, an ED-XRF system with a Rhodium tube was used, leading to a visible Rh signal in the ED-XRF energy spectrum. These x-ray target signals are subtracted automatically from the result table, since they are not part of the sample composition. Nevertheless, Rh can be analysed by ED-XRF via the use of primary filters.
FT-IR spectroscopy can be used for the analysis of a solid, liquid or gas, simultaneously collecting data with high spectral resolution over a wide spectral range. With appropriate accessories, such as attenuated total reflection (ATR) or an FT-IR microscope, even small samples (down to few µm) can be characterised quickly.
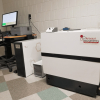
The analyses were conducted using an ED-XRF spectrometer (Shimadzu EDX-8000) and an AIM-9000 infrared microscope attached to an IRAffinity-1S FT-IR spectrophotometer (Shimadzu). Compared to other methods such as atomic absorption spectroscopy (AAS), inductively coupled plasma optical emission spectroscopy (ICP-OES) or inductively coupled plasma mass spectrometry (ICP-MS), both measurement techniques examine the sample destruction-free in its original state. For larger samples, it may be necessary to use a smaller piece to make it fit into the measuring instrument or accessory. If required, further tests can be performed with other analytical instruments to determine additional details of the sample.
Table 1 shows the analysis conditions of the ED-XRF and FT-IR instruments.
Table 1. ED-XRF and FT-IR analysis conditions.
Instrument: EDX-8000/EDX-8000P | |
X-ray tube target | Rh target |
Tube voltage/Tube current | 15 kV (C-Sc, S-Ca), 50 kV (Ti-U)/Auto |
Atmosphere | Vacuum |
Collimator | 1 mm ⌀ |
Integration time | 90 s |
Sample container (film used) | PP film, 5 µm |
Instrument: IRAffinity-1S + AIM-9000 | |
Resolution | 8 cm–1 |
Accumulation | 40 times |
Apodisation function | Sqr-triangle |
Detector | MCT (mercury cadmium telluride) |
Human tooth—strontium and calcium phosphate make the difference
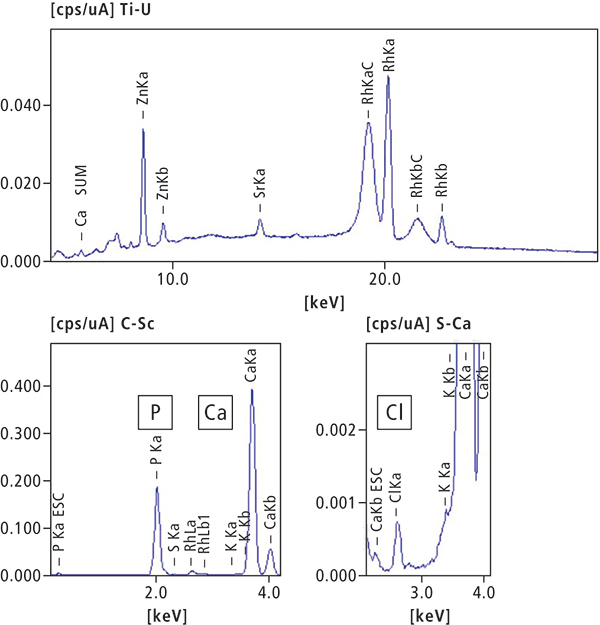
In a first step, a human tooth was analysed. Figure 1 shows a photograph of the contaminant, and Figure 2 shows a qualitative and quantitative analysis by ED-XRF. Calcium (Ca) and phosphorus (P), which are the main components of teeth, could be confirmed. Although the elemental composition is similar to that of bone, the lower content of strontium (Sr) is a characteristic feature of teeth. Like calcium, strontium is an alkaline earth metal and, therefore, can also be used to build teeth.
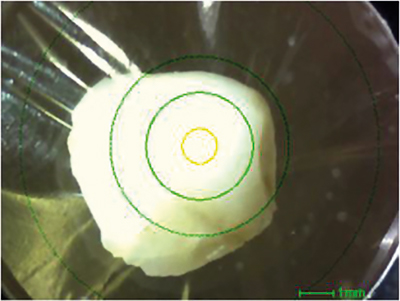
Figure 1. Photograph of contaminant (the yellow circle is the x-ray irradiation range: 1 mm ⌀).
Element | Ca | P | Cl | Zn |
Quantitative value (%) | 70.99 | 27.23 | 1.21 | 0.21 |
Element | K | S | Sr |
|
Quantitative value (%) | 0.18 | 0.16 | 0.019 |
|
Figure 2. ED-XRF qualitative and quantitative analysis results of human tooth.
Figure 3 shows the results of a qualitative analysis by FT-IR spectroscopy. Because the contaminant had a distorted shape and was extremely hard, a small amount of the sample was scraped off and a microscopic transmission measurement was conducted while holding the sample in a diamond cell.
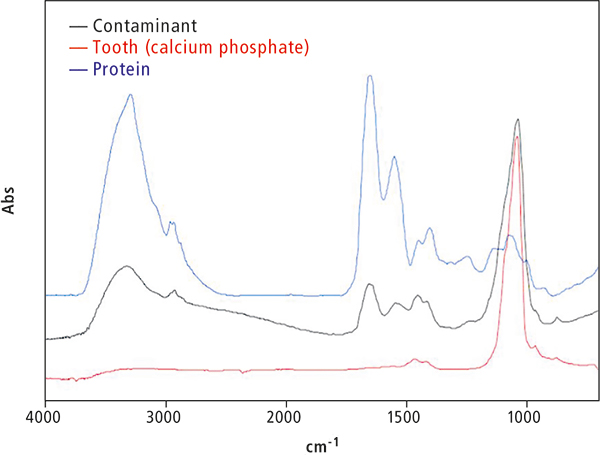
Figure 3. FT-IR absorbance spectrum of human tooth, contaminant and protein.
The main component is calcium phosphate, and peaks originating from proteins can also be confirmed. The proteins are considered to be deposits on the tooth surface. When an adhering deposit exists, the sample is cleaned with water or ethanol, dried and then measured. However, care is required so that the contaminant is not lost before it can be analysed.
Artificial tooth (composite resin): PMMA and PMEA
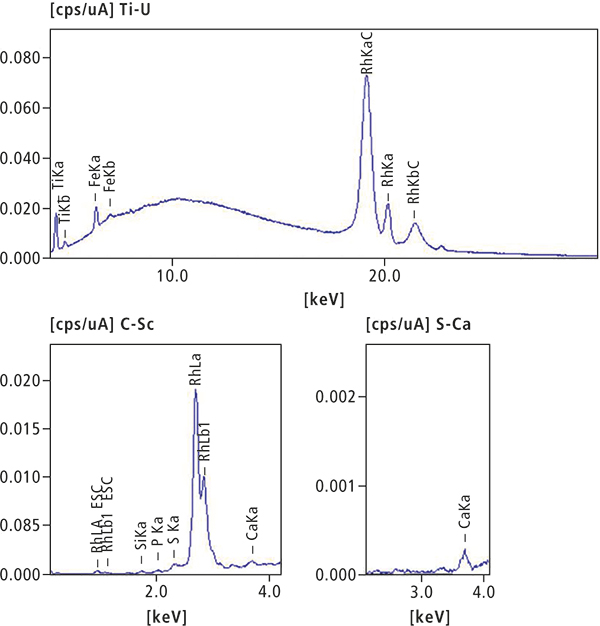
In the second part of the experiment, a piece of an artificial tooth was analysed. A photograph (Figure 4) shows the contaminant, and Figure 5 shows the results of a qualitative and quantitative analysis by ED-XRF. Because the main component is organic material, a quantitative calculation was carried out assuming the balance is CH2O. This is necessary since ED-XRF systems cannot analyse organic material, but can take the matrix effect of the organic composition into account for the elemental concentration calculation. A simplified description of the organic matrix, here CH2O, leads to good quantitative results.
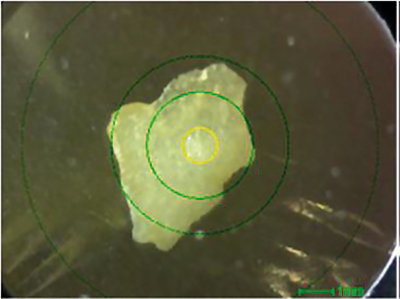
Figure 4. Photograph of contaminant (the yellow circle is the x-ray irradiation range: 1 mm ⌀).
Element | Ti | Si | S | Ca |
Quantitative value (%) | 0.032 | 0.023 | 0.017 | 0.013 |
Element | P | Fe | CH2O |
|
Quantitative value (%) | 0.011 | 0.006 | 99.90 |
|
Figure 5. EDX qualitative and quantitative analysis results.
Figure 6 shows the results of a qualitative analysis by FT-IR spectroscopy. A small amount of the sample was scraped off, and a microscopic transmission measurement was conducted while holding the sample in a diamond cell. An FT-IR library search of the spectra was performed, and hits were obtained for polymethyl methacrylate (PMMA) and polyethyl methacrylate (PEMA). Based on these results, the contaminant is considered to be a piece of artificial tooth (composite resin).
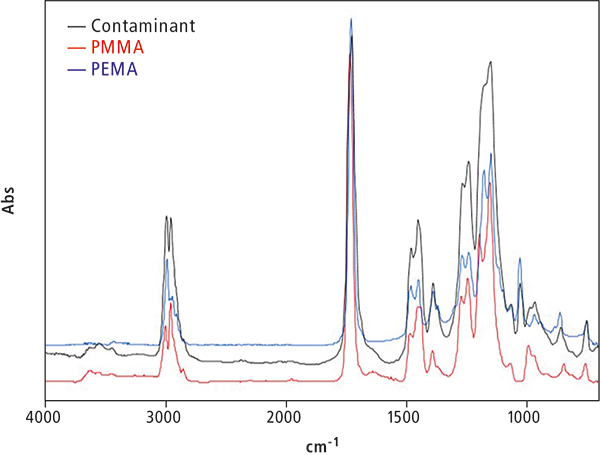
Figure 6. FT-IR absorbance spectrum of contaminant, PMMA and PEMA.
Artificial tooth (metal alloy) made of Ag, Sn and Zn
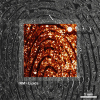
An artificial tooth piece was analysed in the last part of the study. Figure 7 shows a photograph of the contaminant, and Figure 8 shows the results of the qualitative and quantitative analysis by ED-XRF. The main components are silver, tin and zinc. No significant peaks were detected in the FT-IR analysis. Based on these results, the contaminant is an artificial metal tooth filling alloy. Figure 7 shows a piece of a silver crown.
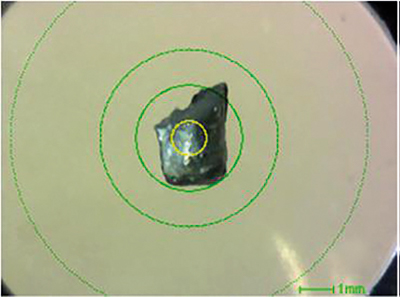
Figure 7. Photograph of contaminant (the yellow circle is the x-ray irradiation range: 1 mm ⌀).
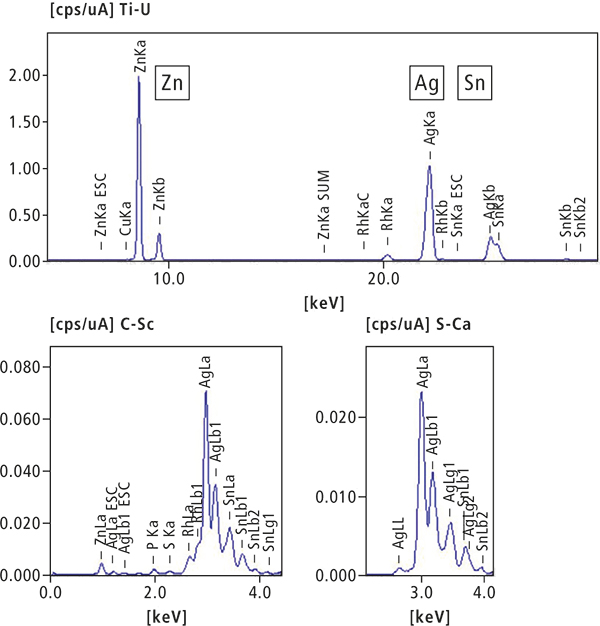
Element | Ag | Sn | Zn | P |
Quantitative value (%) | 61.81 | 22.08 | 15.59 | 0.38 |
Element | S | Cu |
| |
Quantitative value (%) | 0.088 | 0.054 | ||
Figure 8. EDX qualitative and quantitative analysis results.
Conclusion
Contaminants in the form of a human tooth and various dental restorative materials were analysed by ED-XRF and FT-IR microspectroscopy. Due to the diversity of dental materials, which include hybrid materials containing organic and inorganic components, metal materials and others, a combined analysis technique using ED-XRF and FT-IR spectroscopy is very effective. Together, both techniques clarify the molecular and elemental composition of the food containment. Stainless steel, small stones, glass or rubber pieces can be analysed and differentiated quickly.
These techniques support food producers in detecting the cause of food contamination when they receive pieces found in food which are wrongly supposed to originate from the production process, enabling possible customer complaints to be clarified quickly. Since the methods are non-destructive, further analytical steps can be taken afterwards such as AAS, ICP-OES, ICP-MS and others. They provide more in-depth results, if required even down to concentrations in sub-ppm levels.
References
1. W. Bengel, “Amalgam-werkstoff und klinik”, Die Quintessenz 20, 1129–1144 (1990).