Klaus Hollemeyer,a Wolfgang Altmeyerb and Elmar Heinzlea
aBiochemical Engineering Institute, Saarland University, Im St. Johanner Stadtwald, D-66123 Saarbruecken, Germany
bGene-Facts GbR, Science Park 1, Stuhlsatzenhausweg 67, D-66123 Saarbruecken, Germany
Introduction
For several years now, within the EU and the US trade markets there has been intense discussion concerning the retail trade in furs of domestic dog, raccoon dog and cat. Depending on the point of view, and because of a lack of area-wide investigations, quite different numbers are quoted in respect of this non-transparent trade. Animal protection organisations assume that millions of furs of domestic dogs, raccoon dogs and cats are being imported, mainly from Asian countries into the US and the EU markets, where they are sold as made-up garment articles. However, on the other hand, some national governments do not see any need for action because there is no reliable data supporting such an assumed trade. Some countries already have regulations, including USA, Italy, France and Belgium. Trading of such furs is difficult to monitor because of the lack of reliable methods for the unambiguous identification of furs from domestic dogs, raccoon dogs and cats, especially if they are chemically defatted, bleached and/or dyed. So far, although most experts don’t doubt the significant existence of such a trade, too little is known about its volume. It is also without doubt that, at least as far as the domestic dog and cat fur trade is concerned, consumers do not wish to purchase such garments under any circumstances; in addition, the raccoon dog fur trade increasingly angers more and more consumers.
Non-labelling or misleading declarations of products partly or completely made of domestic dog, raccoon dog and cat furs is helping to mislead consumers and must be judged as fraudulent (see, for example, Figure 1). A new variety of this fraudulent trade is that of the selling of real fur as faux fur, which is mainly made from raccoon dogs. Synthetic pelt is quite in fashion at the moment and it seems that buying real fur is cheaper for the retail market than synthetics. As a consequence of this the US Congress has appealed to also ban the trade with raccoon dog furs in the USA. In Europe the EU commission has been asked to construct legal regulations to overcome local legal requirements that contradict the public spirit of the EU and partly hinder the free exchange of goods. Postulated regulations also have to contain reliable methods in order to monitor effectively any planned ban.
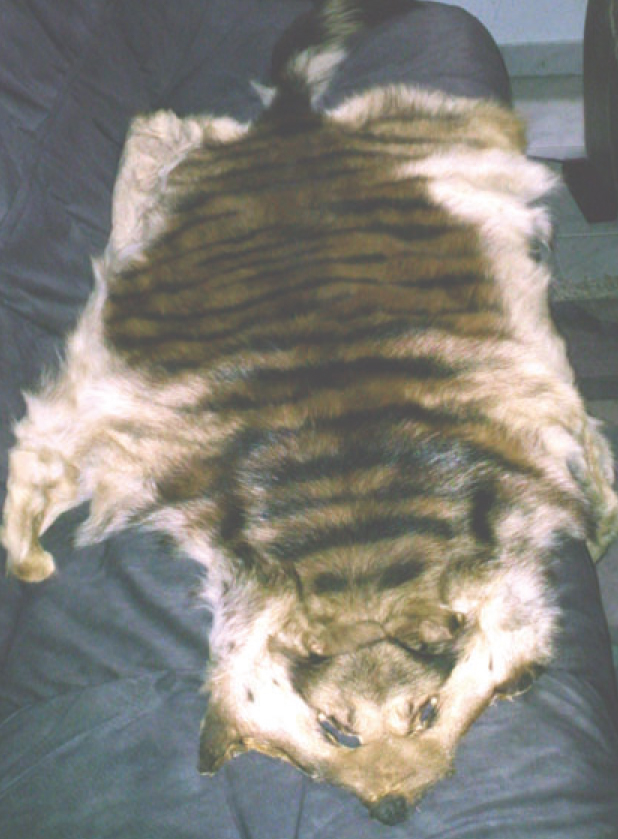
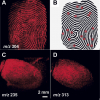
Figure 1. Falsification of a domestic dog fur imported from Asia by a tourist. The fur was sold as a supposed tiger pelt. Clearly the typical face of a German shepherd dog can be recognised as well as the missing markings along the flanks.
In autumn 2003 we therefore introduced our SIAM method (Species Identification of Animals MALDI-TOF mass spectrometry) to the EU commission; this is an analytical method suitable for recognising the origin of feathers, down and hair with high confidence by mass spectrometry. In November 2006 the EU commission made a proposal for the ban of the domestic dog and cat fur trade within the EU market.1 As an alternative to microscopic and principal component regression (PCR) methods, the SIAM method developed in our Institute in collaboration with the Gene-Facts company, was mentioned as outstandingly dependable.2 This proposal, which will be enacted in January 2008, provides compliant regulations together with analytical protocols for the objective monitoring of any domestic dog and cat fur trade.
SIAM method description
The SIAM method is routinely used for the identification of avian and mammalian species. The reliability of the method, using unknown mammalian test samples, was confirmed by LGC laboratories3 on behalf of the British government in 2005. Compared to PCR methods, the SIAM method is also able to correctly identify feathers, down and mammalian furs, even after chemical treatment such as degreasing, bleaching and/or dyeing.
In the method, a small piece of about 1 mg of a single feather, down or hair sample is sufficient to perform an analysis, which is undertaken without any prior or subsequent separation or enrichment steps. The sample is chemically reduced as a whole in a boiling water bath to destroy the intra- and inter-molecular disulfide bridges of the protein chains and to break three-dimensional structures. After cooling down, the sample is mixed together and incubated with trypsin, an endoproteolytic enzyme, which cleaves the protein chains into their lysine and arginine residues. Incubation takes place at 37 °C for two hours. This digest procedure results in a pool of cleaved peptides stemming from a variety of keratins and other structural proteins of hair or feathers and down, respectively. The formed peptides are mixed together with CCA-matrix, (alpha cyano-4-hydrox-ycinnamic acid in 50 % acetonitrile and diluted trifluoro acetic acid), and 0.8 μL of this solution is dropped onto a steel target plate and air dried. Analysis by matrix-assisted laser desorption/ionisation-time of flight (MALDI-ToF) mass spectrometry (MS) sorts the cleaved peptides according to their molecular weight-to-charge ratio (m/z), forming a peptide pattern specific for the mammalian species investigated. The method exclusively measures peptides, but does not detect nucleotides or other biopolymers. Comparisons of unknown peptide patterns are performed with those of known species stored in data libraries as reference entries. The higher the conformity is between two spectra, which means the smaller the mathematical correlation distance, the closer is the zoological relationship between the two species. This results in reliable identification of an unknown sample. Additional uses of species-specific peaks exclusively occurring in single species and used as diagnostic peaks enhance the confirmation of the findings.
Instrumentation
The SIAM analysis was performed on a 4800 ToF/ToF analyser mass spectrometer (Applied Biosystems, Darmstadt, Germany) in positive reflector mode. The system uses a pulsed 200 Hz solid-state laser at a wavelength of 355 nm. Source 1 voltage was set to 20 kV with a grid voltage of 16 kV. 2.19 V was applied to the reflectron detector. Peptide masses of a mix of standard peptides were used for a wide range calibration from 0.8 kDa to 4 kDa with a delay time of 600 ns. (The standards were: des-arg1-bradykinin, angiotensin I, glu1-fibrinopeptide, ACTH 1–17 clip, ACTH 18–39 clip and ACTH 7–38 clip.) One single standard peptide mass spectrum was formed out of 20 sub-spectra per spot; each with 25 laser shots kept below the saturation threshold of the detector. Exclusively monoisotopic peaks were taken into account and calculated from the six standard peptides with a minimum signal-to-noise ratio of 20, and a resolution better than 10,000. Mass tolerance was set to ±0.3 Da with maximum outlier of 5 ppm. Accepted internal calibration settings were used as default parameters to measure real-sample spectra in the range of 1–3 kDa with a minimum signal-to-noise range of 10, and a resolution better than 6000.
The MALDI-ToF mass spectrometric measurement arranges the cleaved peptides according to their molecular masses (m/z) forming a single mass spectrum of peptide pattern with their particular intensities. Several single mass spectra from one sample, each from a distinct spot are combined into one recalculated average spectrum, thus eliminating trypsin autoproteolytic peptides as well as slight intensity variations between the single measurements. A corrected mammal average spectrum always contains perseverative peptide masses that occur in almost all investigated mammalian orders. Besides these there are other peptide masses, which are selectively representative for zoological families and/or genera within the mammalians. Species-specific peptides, however, occur exclusively in single species and can be used as diagnostic masses.
The average spectra originating from known species are stored as reference entries in data libraries. The average spectra from unknown species are identified by binary mathematical comparisons with the stored data using the “Correlation distances” (dr,s):
[EQN]
where [EQN]
and [EQN]
The relationship computes the Euclidean distance between pairs of objects in a n × p data matrix X. Rows of X correspond to observations; columns correspond to variables. dr,s is a row vector of length (n – 1) × n/2, corresponding to the (n – 1) × n/2 pairs of observations in X. The distances are arranged in the order (1,2), (1,3), …, (1,n), (2,3), …, (2,n), …, …, (n – 1,n). dr,s is commonly used as a dissimilarity matrix in clustering or multidimensional scaling. The various distances between the vector xr and xs are defined as Correlation distances.
The vector dr,s is converted into a square matrix so that element i,j in the matrix corresponds to the distance between objects i and j in the original data.
This is a special form of the Euclidean match factor calculations4 ranging from 0 to 1.0. Results are presented as a list of distance values, whereby the smallest distance value indicates the highest similarity between two spectra and gives the best fit. Generalising, one can say that within a zoological genus or family the similarities of the average spectra are at the highest level and become smaller and smaller the larger the zoological distance becomes between two mammals. Moreover, this behaviour reflects a kind of phylogenetical memory of hair hidden in its proteins. Figure 2 shows the cluster tree of distantly related individuals, each belonging to a different zoological order. In no case is a smaller correlation distance than dr,s = 0.6 reached. In contrast, Figure 3 shows dr,s separations as small as about 0.2 for raccoon dog compared to domestic dog, two closely related species from the same family but different genera. The cluster of the carnivores is clearly discriminated from those of the two herbivores.
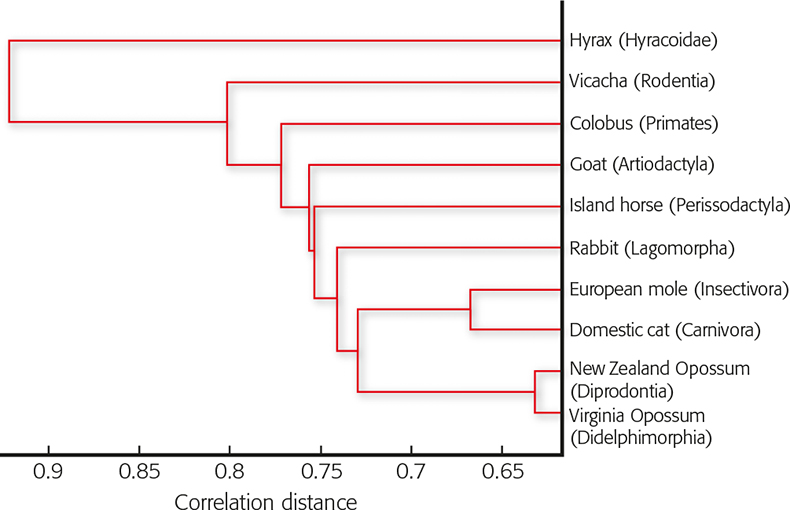
Figure 2. Dendrogram of the relationship of members of different zoological orders according their peptide patterns of hair digests. The diagram reflects a phylogenetical cluster tree. Correlation distances larger than 0.6 indicate distant relationships.
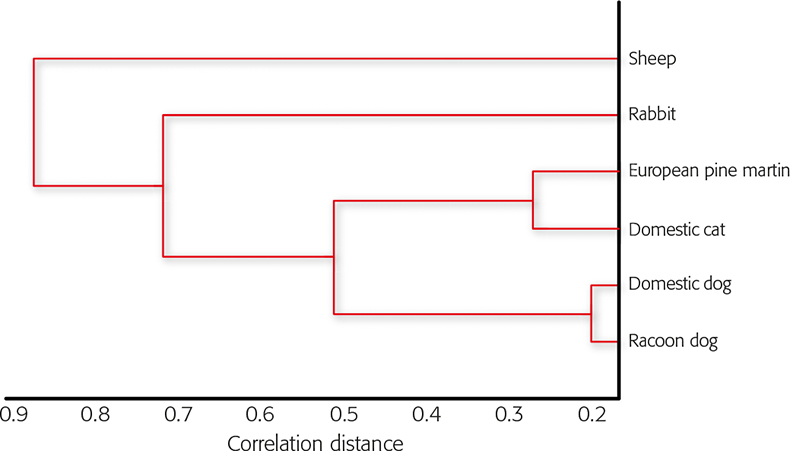
Figure 3. Correlation distances of several mammalian species calculated from mass spectrometric data from the tryptic hair analyses.
The phylogenetical memory of hair is the reason for the very practical effect that an unknown species can be allocated at least to a zoological genus or family, even if there is not an identical reference entry in the library available. This can be particularly effective if the level of identification in the database is set to the zoological family or subfamily. In the future, the fur-trade will be forbidden from trading in all members of the Pantherinae subfamily, and almost all members of the Felinae subfamily in the USA and the EU. For example an unknown sample can be identified as a member of Pantherinae without the exact matching species reference entry and be recognised as a protected species.
Fur differentiation of racoon dog, domestic dog, rabbit and domestic cat
Furs from raccoon dog (Nyctereutes procyonoides) from the Canidae family and rabbit (Oryctolagus cuniculus) from the Leporidae family are often mistaken for domestic dog (Canis familiaris) and domestic cat (Felis catus), respectively. Furthermore, in many cases especially in the USA where faux fur is in vogue, real raccoon dog fur is sold instead and is either not labelled or mislabelled. The different fur types are hard to discriminate between visually, especially if they are bleached and/or dyed. Many requests for analysis concern the identification of suspect fur samples for such cases. Discrimination of faux fur from real pelt is easily achieved because the synthetic polymers cannot be cleaved by trypsin, therefore they only yield some auto-proteolytic peptides from trypsin itself. Unfortunately most falsifications cannot be recognised so easily. In these cases the SIAM method is a highly useful tool. Figures 4 and 5 both show the similarities and differences of mass spectrometric average spectra of tryptic digests from raccoon dog against domestic dog and rabbit against domestic cat, respectively. The green lines indicating common masses in both spectra also show similar relative intensities in each, and the comparison shows the close relationship between the two species. If black lines are dominant in the spectral comparison, the two species are only distantly related. Within the same family (domestic dog and raccoon dog) the distance is small with dr,s = 0.1991 and within the carnivores (marten, dog, cat, raccoon dog) the distances are smaller than compared to other orders like Artiodactyla (sheep) and Lagomorpha (rabbit) (Table 1).
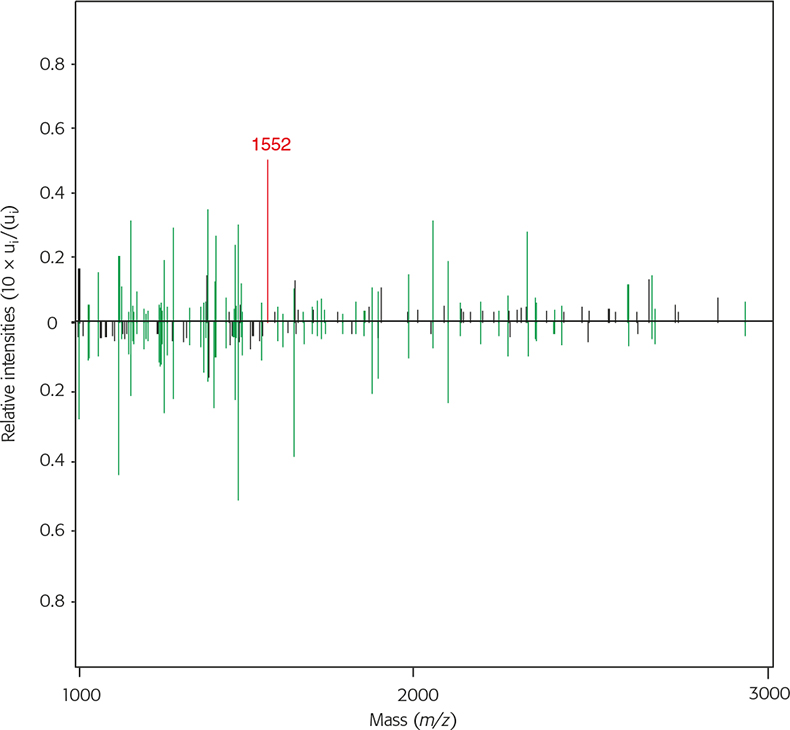
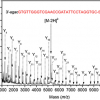
Figure 4. Two average MALDI mass spectra from raccoon dog (upwards) and domestic dog (downwards) in the range from 1 kDa to 3 kDa with their relative intensities. Green lines represent identical masses, black lines represent different masses and the red line is a diagnostic peak used for additional differentiation between raccoon dog and domestic dog.
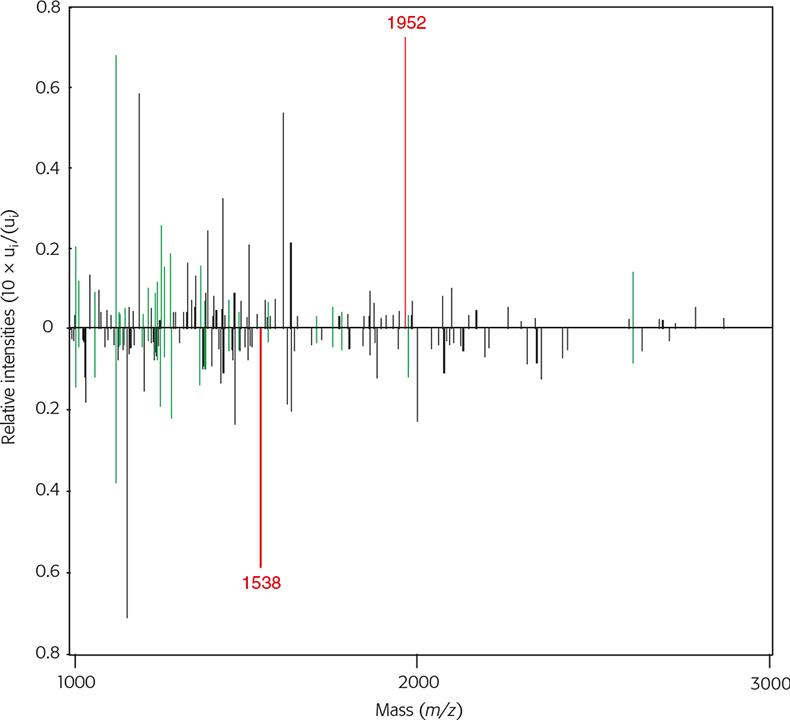
Figure 5. Two average MALDI mass spectra from rabbit (upwards) and domestic cat (downwards) in the range from 1 kDa to 3 kDa with their relative intensities. Green lines represent identical masses, black lines represent different masses and the red line is a diagnostic peak used for additional differentiation between rabbit and domestic cat.
Table 1. Correlation distances of mass spectrometric data of tryptic hair digests between domestic cat and raccoon dog against some selected species. The larger the correlation distance the smaller are the spectral similarities.
Family | Felidae | Family | Canidae |
Species | Felis catus | Species | Nyctereutes procyonoides |
Trivial name | Domestic cat | Trivial name | Racoon dog |
European pine marten | 0.2682 | Domestic dog | 0.1991 |
Domestic dog | 0.5207 | European pine marten | 0.5119 |
Racoon dog | 0.5238 | Domestic cat | 0.5238 |
Rabbit | 0.7442 | Rabbit | 0.7639 |
Sheep | 0.8998 | Sheep | 0.9247 |
The distance calculations gives raccoon and domestic dogs as the best match, but this value lies in between the distribution range also for other canine species (dr,s = 0–0.5). Therefore additional exclusion parameters have to be taken into account. Table 2 shows some common and diagnostic MS peaks used in this investigation. While m/z 1066 is completely unspecific, m/z 1109 is uniquely specific for the Artiodactyla order and m/z 1952 for the Leporidae family. Further peaks are specific for species, genera and/or families. Raccoon dog has a species-specific mass of m/z 1552, a diagnostic peak suitable to distinguish it from domestic dog samples, foxes, wolves and coyotes.
Table 2. Some common and diagnostic MALDI-ToF MS peaks occurring in different mammalian families.
Order | Family | Mass (m/z) | |||||
1066 | 1109 | 1465 | 1538 | 1552 | 1952 | ||
Artiodactyla | Bovidae | + | + | O | O | O | O |
Camelidae | + | + | O | O | O | O | |
Cervidae | + | + | O | O | O | O | |
Suidae | + | + | O | O | O | O | |
Lagomorpha | Leporidae | + | O | O | O | O | + |
Perissodactyla | Equidae | + | O | O | O | O | O |
Carnivora | Canidae: | + | O | + | O | +/O | O |
Felidae | + | O | O | + | O | O | |
Mustelidae | + | O | O | + | O | O | |
Phocidae | + | O | O | + | O | O | |
Procyonidae: | + | O | + | +/O | O | O | |
Ursidae | + | O | O | + | O | O | |
Viverridae | + | O | O | + | O | O | |
Primates | Hominidae | + | O | O | + | O | O |
Legend: “+” indicates present, “O” indicates absent
The similarities between rabbit and big and small cats originating from different families are low having a correlation distance of dr,s = 0.7742, as shown in Figure 6. The accuracy of the discrimination is confirmed using different diagnostic masses specific for some families of the carnivores and the investigated species of the Leporidae family. These are used as additional exclusion criteria. While some of the carnivore families as well as the Hominidae family have the m/z 1538 mass peak, this mass is missing in rabbit and hare (Lepus europaeus) spectra, both of which are from the Leporidae family. In contrast, both Leporidae species have the m/z 1992 mass not occurring in any carnivore sample examined so far.
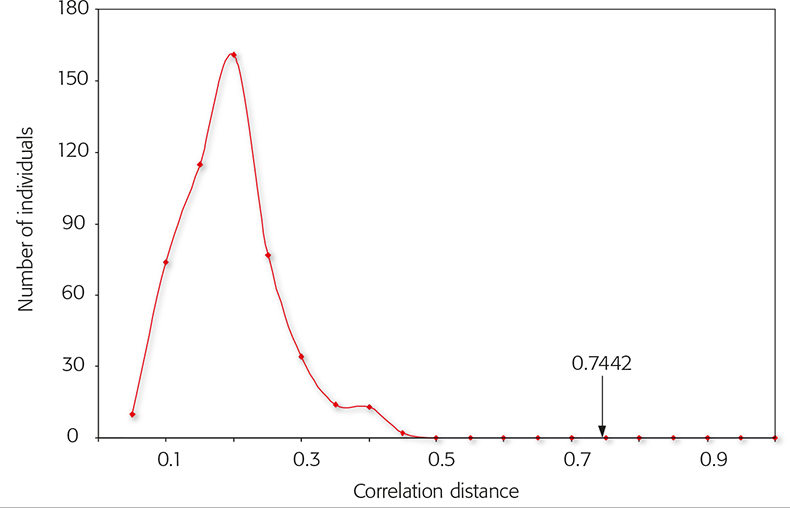
Figure 6. Correlation distance distribution of big and small cats among each other. More than 500 comparisons were performed within the Felidae family. Inter-feline distances were always smaller than 0.5. The arrow shows the distance of the spectral data of rabbit fur compared to the feline data.
Conclusions
The SIAM method is a fast and reliable tool for the identification of mammalian species. As has been demonstrated, the differentiation of rabbit fur from domestic cat fur is clear and without ambiguity. The correlation distance between the two species is much larger than the distribution range within big and small cats themselves. Every feline spectrum can be clearly distinguished from a rabbit spectrum. For the discrimination of furs from raccoon dog from domestic dog fur an additional step is necessary. In the first step all other families must be discriminated from the canines by the distance calculations. The second step uses species-specific masses for the identification. Within the canine family no other member must show the specific diagnostic mass.
SIAM analyses can be performed within a few hours. Although we are using a high-end reflectron device with MS-MS options, a linear MALDI-ToF mass spectrometer with a reduced mass accuracy can also be used, as we only use integer masses for calculations. Currently we are in negotiation with a leading manufacturer to compile an attractive option of a linear MALDI-ToF device equipped with suitable analysis software and the SIAM database to satisfy the rapidly growing interest in the method.
References
- Cat and dog fur: Commission proposes total EU ban, Reference IP/06/1586 from 20/11/2006 (http://europa.eu/rapid/pressReleaseAction.do).
- K. Hollemeyer W. Altmeyer and E. Heinzle, “Identification and quantification of feathers, down and hair of avian and mammalian origin using MALDI-TOF-mass spectrometry”, Anal. Chem. 74, 5960–5968 (2002). doi: https://doi.org/10.1021/ac020347f
- LGC Limited. Registered in England No. 2991879 VAT No 674 0567 21 Registered office: Queens Road, Teddington, Middlesex, TW11 0LY, UK.
- MatLab R2006a software from MathWorks Inc., 3 Apple Hill Drive Natick, MA 01760-2098, USA.