Giorgio S. Senesia* and Russell S. Harmonb
aCNR - Istituto per la Scienza e Tecnologia dei Plasmi (ISTP), Sede di Bari, Bari, 70126 Italy
bDepartment of Marine, Earth, and Atmospheric Sciences, North Carolina State University, Raleigh, North Carolina 27695, USA
DOI: https://doi.org/10.1255/sew.2021.a17
© 2021 The Authors
Published under a Creative Commons BY-NC licence
Introduction
Knowledge about the chemical composition of minerals, rocks and soils is of fundamental importance in the earth and environmental sciences (i.e. geosciences). Historically, during the late-19th and mid-20th centuries classical wet chemical analytical methods were the means of determining the elemental composition of such geological materials. Since then, intensive research in analytical inorganic chemistry has led to the development of a multiplicity of rapid and accurate instrumental analytical techniques for use in the laboratory that can be applied to elemental analysis across the periodic table. This has been of particular benefit to research in the geosciences, where the need for chemical data has continuously expanded with regard not only to the type of elements and their concentration levels, but also application to a wide variety of geological materials across the solid–liquid–gas spectrum.
One of the enduring needs within the geoscience community has been the availability of analytical instrumentation capable of routine use outside the laboratory setting. Laser-induced breakdown spectroscopy (LIBS) is one of the very few current analytical technologies suitable for routine use outside the laboratory and has a persuasive set of advantages that makes it ideally suited for chemical analysis in the field. These include rapid analysis with a compact and lightweight instrument by a single individual of most types of natural materials under ambient environmental conditions in real time, and with little to no sample preparation. Although such a field analytical technique does not provide the level of elemental detection and analytical precision possible with laboratory instruments, it nevertheless provides an efficient and invaluable capability to the field investigator.
To date, LIBS has been applied widely across the geosciences in sub-fields as diverse as mineralogy and petrology, volcanology, sedimentology, natural resources exploration and exploitation, pedology, and geoarchaeology.1,2 The most common applications of LIBS in the analysis of geological materials include: (i) elemental detection and identification; (ii) quantitative elemental analysis; (iii) microscale geochemical mapping; (iv) discrimination and classification of minerals and rocks of similar character via spectral matching against an assembled spectral library; and (v) determination of sample geographical origin and provenance. Although LIBS is not able to address all questions arising in geochemical research and practice due to some inherent limitations in sensitivity, it can excel for specific geoscience applications.
The LIBS technique
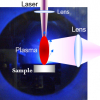
The four essential components of a LIBS instrument are (i) a laser, the most commonly utilised of which is the short-pulsed, Q-switched laser that releases the large amount of energy over a short interval of time needed to ablate the sample; (ii) a time control system, which allows precise control of the analytical sequence—the beginning of laser pulse, the number of pulses, the interval between pulses, the beginning of emission capture and the signal acquisition interval; (iii) a set of optics comprised of mirrors and lenses that focuses the laser light onto the sample and then collects the light emitted from the plasma; and (iv) a spectrometer/detector system for the collection and spectral discrimination of the plasma light emission that contains information on the sample composition and physical conditions of the plasma.
The high-energy laser pulses are focused on the sample surface, which may be in air or in an inert gas at ambient or controlled pressure. This laser–material interaction results in the ablation of picograms to nanograms of the sample and its vaporisation to produce a high-temperature plasma containing the thermally excited analyte. As the plasma cools down, the excited ions, atoms and molecules decay to lower energy levels and, in doing so, emit electromagnetic radiation that is typical of each species present. Collection of this light by a detector/spectrometer produces an emission spectrum for the sample in which the intensity of each spectral line is proportional to its concentration in the sample analysed. The acquired signals are then processed, visualised and analysed using spectral analysis and chemometric software. An optically thin plasma in the condition of Local Thermodynamic Equilibrium (LTE) is expected to yield a LIBS spectrum (Figure 1) that directly reflects the elemental composition of the sample.3
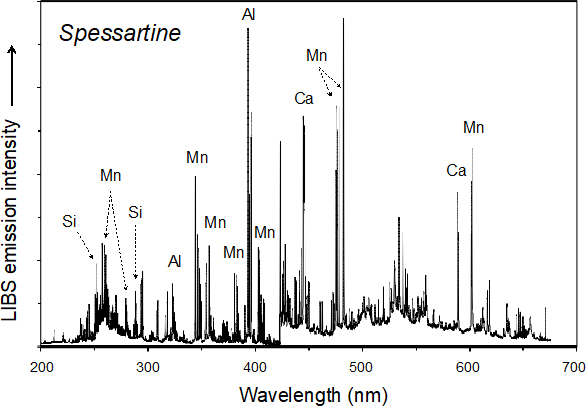
Figure 1. Broadband LIBS spectrum for the spessartine variety of the aluminosilicate garnet (Mn3Al2Si3O12).
Quantitative elemental analysis by LIBS is based on the proportionality between the spectral emission line intensity of the element and its concentration in the sample analysed, which can be ascertained by constructing a classical calibration curve that relates the measured elemental line intensity to the elemental concentration of standards of known composition measured under the same analytical conditions. A conceptually different approach is the calibration free LIBS method that avoids the use of calibration standards and was developed to address sample matrix issues. This procedure is based on the assumption that the LTE condition is fulfilled within a LIBS plasma, thus allowing calculation of certain plasma characteristics (i.e. excitation temperature and electron density) from which the elemental composition of the sample can then be estimated.4 Furthermore, multivariate statistical methods have opened a new path for LIBS analysis beyond traditional univariate calibration. In particular, these methods use all the information contained in a LIBS spectrum, rather than just that for one or more emission lines in a limited portion of it. Such an approach allows for both quantitative analysis as well as the identification/discrimination of different geomaterials.5
Unique attributes of LIBS for geomaterial analysis
LIBS was introduced as a laboratory analytical technique in 1963, but commercial instruments only became available in the 1970s and 1980s.6 These were subsequently refined, closely tracking technological progress in the development and miniaturisation of lasers, detectors and spectrometers.
Compared to many other common analytical techniques, which are mostly laboratory based and often require complex and time-consuming procedures, LIBS features several attributes that make it an attractive and unique tool for the analysis of geological and environmental materials. These include:
- Instrumentation requiring only a small number of relatively simple components (i.e., a laser, optics, a detector/spectograph and a computer);
- Rapid real-time (<1 s) analysis;
- Simultaneous capture of the full elemental composition of a sample with a single laser pulse based on one or more emission lines in the spectral region between 200 nm and 900 nm;
- Particular sensitivity to light elements such as H, Li, Be, B and C, which cannot be readily analysed by many other analytical techniques;
- Requirement of only picograms to nanograms of material for the analysis;
- Capacity to clean the sample surface by removal of particulates and biofilms;
- Capability to analyse mineral and rock surfaces with sub-millimetre spatial resolution;
- Ability for stratigraphic compositional profiling within a sample down to >100 µm depth;
- In situ analysis of individual particles and mineral grains plus liquid and solid inclusions;
- Megapixel compositional mapping at kHz rates of compositionally complex samples at tens of µm spatial scale with ppm-level sensitivity;
- Capacity to perform stand-off analysis with the sample located at some distance from the instrument;
- Availability of portable and handheld instruments allowing on-site, in-field analysis.
The relativity recent development and introduction of handheld LIBS (hLIBS) instruments represents a promising milestone, particularly because LIBS instrumentation is generally more robust, less expensive and has lower day-to-day operating costs than many other analytical techniques. Although further technological refinement will undoubtedly continue, hLIBS analysers have already been utilised for a wide variety of geoscience applications and this trend will undoubtedly continue as its use becomes more widespread across the earth and environmental sciences community.
Over the last two decades, hyphenated approaches that couple LIBS with Raman or laser-induced fluorescence (LIF) or inductively coupled plasma have expanded widely the capabilities of the technique as an invaluable geochemical tool.2 These techniques can be combined conveniently with LIBS as they also make use of handheld instrumentation, thus permitting simultaneous, complementary and multi-elemental analysis. For example, the SuperCam suite installed onboard the NASA Mars 2020 Perseverance rover comprises co-aligned LIBS, visible-near infrared and Raman analysers and colour imaging, which allows simultaneously analysis for (i) the identification of minerals at the sub-mm spatial scale; (ii) the characterisation of rock textures and coatings; (iii) the determination of sediment stratigraphy; (iv) the search for organics and bio-signatures; and (v) the measurement of the degree of aqueous alteration of rocks by quantifying their volatiles content.7
Applications of LIBS across the geosciences
As described in the review paper by Harmon and Senesi,2 LIBS has been shown to be very well suited for the rapid identification, classification and discrimination of minerals in compositionally complex rocks. For example, LIBS analysis can be used to readily identify aluminosilicate minerals containing light elements, such as spodumene by Li, beryl by Be and tourmaline by B. Bulk analysis of coarse-grained rocks is often difficult, but LIBS has shown to be straightforward and effective for the quantitative analysis of fine-grained sedimentary rocks and their metamorphic equivalents, e.g. limestones/marbles and shales/slates, metamorphic hornfels and igneous rocks (e.g. basalt, andesite and rhyolite), and for discrimination of tholeitic, sub-alkaline and transitional alkaline volcanic series.
LIBS coupled with chemometric data processing methods has shown a great potential for a broad spectrum of practical geoscience applications including environmental monitoring and remediation,8 paleoclimate reconstruction,9 stratigraphic correlation,10 geoarchaeology,11 the determination of material properties,12 mineral provenance determination13 and mineral exploration, prospect evaluation and quality control in deposit exploitation.14–16 The application of chemometric methods to LIBS data in a geological context is continuously increasing as spectral databases grow ever larger and are applied to an increasing variety of geomaterials for new purposes.5 For example, a correlation of rock units was attempted on 16 limestone beds collected from three quarries in Kansas (USA) by processing their LIBS chemical fingerprint data using various chemometric methods such as principal component analysis, soft independent modelling by class analogy and partial least squares regression analyses to obtain a stratigraphic interpretation.10
The determination of gemstone provenance is an important issue for the gemmological community and diamond industry for both financial and security reasons. Multivariate LIBS analysis has shown a high potential to identify gem provenance.17 LIBS is also a unique tool for the accurate and rapid control of the origin of minerals extracted in areas of civil conflict and sold to sustain fighting, such as columbite-tantalite.18
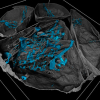
Natural resources exploration is one of the fundamental activities of geology. The discovery and exploitation of new deposits is required to supply minerals and other resources to an ever-expanding global population. Another unique feature of LIBS is its capability of performing elemental identification and multi-elemental compositional mapping at high spatial resolution of a geological specimen,15 for which quantification can be subsequently performed using a calibration curve approach. In particular, LIBS can be used efficiently as a mapping tool for light elements, and to complement other mapping methods. For examples, LIBS-based maps of Li distribution in hydrothermally altered spodumenes from the Li pegmatite deposit at Neoarchaean Mt Cattlin in Western Australia facilitated efficient discrimination between spodumene, its altered compounds and matrix silicate minerals.19 The use of 2-D mapping LIBS combined with two other techniques not able to detect Li provided additional unique information that allowed discrimination of Li-bearing and Li-free feldspar (a Na-K-Ca aluminosilicate). LIBS data combined with other types of data were used by Nikonow et al.20 to map mineral alteration and differentiate different types of chlorite (a Mg, Fe, Ni and Mn phyllosilicate). LIBS in combination with LIF was used to map even the elemental distributions of rare earth elements in minerals at different locations in a sample by monitoring the plasma formed from a single laser shot.21 More recently, Rifai et al.22 performed the ultrafast composite mapping of elemental distributions by acquiring nearly half-million LIBS spectra of Na, Mg, Al, Si, S, K, Ca, Fe, Ni, Cu, Pd and Pt over multiple 30 × 40-mm areas of drill cores collected from a Pt-Pd mine in the Stillwater layered mafic complex in Montana (USA) (Figure 2). That same year, Nardecchia et al.23 developed a new LIBS spectral analysis strategy, called embedded k-means clustering, which allowed a deeper and more sensitive examination and mapping of both major and minor elements in a complex mineral sample originated from the Tighza polymetallic W-Au-Pb-Zn-Ag (Sb-Ba) deposit in central Morocco.
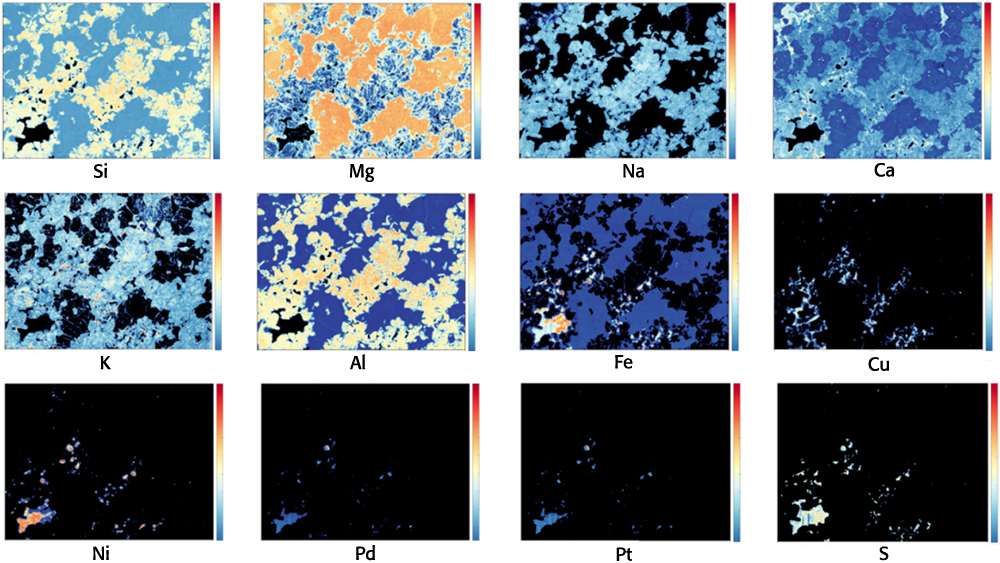
Figure 2. Single element microscale LIBS mapping for Si, Mg, Na, Ca, K, Al, Fe, Cu, Ni, Pd, Pt and S on a 40 × 30 mm section of drill core containing platinum and palladium from the JM Reef at the base of the banded zone in the Stillwater Igneous Complex, a layered mafic intrusion in southwestern Montana (USA). The JM Reef consists of pegmatitic peridotite and troctolite containing the sulfide minerals pyrrhotite [Fe(1 – x)S], pentlandite [(Fe,Ni)9S8], and chalcopyrite [CuFeS2], with overall assayed concentrations of 110 ppm Pd and 21 ppm Pt. As shown on the scale bar beside each of the 12 plots, elemental emission line intensities are scaled between 0 (dark blue) and 1 (red). Modified from Reference 22 under a CC BY licence.
The mining industry worldwide makes use of well-established, but time-consuming and expensive, laboratory techniques for ore chemical analysis, so that the availability of rapid and precise techniques for on-site analysis of ore materials would be helpful to both exploration and exploitation. The recent development of commercial field-portable and hLIBS analysers has facilitated the rapid, on-site qualitative and quantitative elemental analysis, classification, discrimination and imaging of a wide variety of geological samples. This has permitted the rapid acquisition of compositional data and their rapid interpretation in a mineralogical context, which highlights the unmatched potential of LIBS for field applications.24 For example, both conventional laboratory LIBS and hLIBS have been used to identify the relative amounts of Ag in placer deposit Au specimens, whereas PLS-discriminant analysis of LIBS broadband spectral analysis was able to determine sample provenance.25 An hLIBS analyser was used for the rapid detection and analysis of Au in the MacLellan deposit at Lynn Lake, Manitoba (Canada) and to detect minor and trace element signatures of sulfide phases, whose relative abundance assisted in mineral identification.26 Furthermore, LIBS raster mapping allowed for the rapid discrimination of arsenian pyrite and arsenopyrite, the two main As-bearing phases at MacLellan, from other Fe-bearing minerals in the sample matrix. More recently, Lawley et al.16 demonstrated that the resolution of hLIBS-based geochemical imaging was sufficient to map a suite of kimberlite-hosted mantle xenoliths in Nunavut (Canada). In particular, LIBS was particularly sensitive for mapping the microscale distribution of elements with low atomic number, e.g. Li and Na, which represent important geochemical tracers of hydrothermal and magmatic processes but are difficult to detect at low concentrations with other field-portable analytical technologies.
Final considerations and perspectives
A variety of different laboratory, stand-off, field-portable and handheld LIBS instruments have been used for geoscience applications during the last two decades. These applications include elemental identification and quantification, mineral recognition and discrimination, provenance determination, the stratigraphic correlation of rocks, and material property determination. Such LIBS studies application provided unique insights into geological environments and their formation and subsequent history. The very successful use of LIBS on Mars, which had been used to analyse >4000 rocks, minerals and soils up to December 2020, has greatly boosted interest in using hLIBS and for applications here on Earth.
The analysis of complex materials like rocks and soils by LIBS is strongly affected by sample inhomogeneity and matrix effects that might be overcome by processing a massive number of spectra to “homogenise” the data. Supervised machine learning and chemometric methods have advanced the LIBS applications to rock analysis and classification, also allowing the matrix effects to be used beneficially as a fingerprint for that specific LIBS spectrum.
The brightest prospects for LIBS in geosciences will probably occur along three promising directions: micro-LIBS imaging, fast remote diagnosis of geological and environmental processes, and event prediction. Advances in the use of LIBS in the geosciences are also expected in the areas of geochemical prospecting, material property determination, volcanic gas studies for the prediction of volcanic eruptions, in support of broadband seismology and satellite observations of ground deformations.
References
- C. Fabre, “Advances in laser-induced breakdown spectroscopy analysis for geology: a critical review”, Spectrochim. Acta B 166, 105799 (2020). https://doi.org/10.1016/j.sab.2020.105799
- R.S. Harmon and G.S. Senesi, “Laser-induced breakdown spectroscopy – a geochemical tool for the 21st century”, Appl. Geochem. 128, 104929 (2021). https://doi.org/10.1016/j.apgeochem.2021.104929
- D.A. Cremers and L.J. Radziemski, Handbook of Laser-Induced Breakdown Spectroscopy, 2nd Edn. John Wiley & Sons, Chichester (2013). https://doi.org/10.1002/9781118567371
- A. Ciucci, M. Corsi, V. Palleschi, S. Rastelli, A. Salvetti and E. Tognoni, “New procedure for quantitative elemental analysis by laser-induced plasma spectroscopy”, Appl. Spectrosc. 53, 960–964 (1999). https://doi.org/10.1366/0003702991947612
- J.L. Gottfried, “Chemometric analysis in LIBS”, in Handbook of Laser-Induced Breakdown Spectroscopy, Ed by D.A. Cremers and L.J. Radziemski, 2nd Edn. Wiley, Chichester, pp. 223–255 (2013). https://doi.org/10.1002/9781118567371.ch7
- L. Radziemski and D. Cremers, “A brief history of laser-induced breakdown spectroscopy: from the concept of atoms to LIBS 2012”, Spectrochim. Acta B 87, 3–10 (2013). https://doi.org/10.1016/j.sab.2013.05.013
- R.C. Wiens et al., “The SuperCam instrument suite on the NASA Mars 2020 rover: body unit and combined system tests”, Space Sci. Rev. 217, 4 (2021). https://doi.org/10.1007/s11214-020-00777-5
- D.A. Gonçalves, G.S. Senesi and G. Nicolodelli, “Laser-induced breakdown spectroscopy applied to environmental systems and their potential contaminants. An overview of advances achieved in the last few years”, Trends Environ. Anal. Chem. 30, e00121 (2021). https://doi.org/10.1016/j.teac.2021.e00121
- J.O. Cáceres, F. Pelascini, V. Motto-Ros, S. Moncayo, F. Trichard, G. Panczer, A. Marín-Roldán, J.A. Cruz, I. Coronado and J. Martín-Chivelet, “Megapixel multi-elemental imaging by laser-induced breakdown spectroscopy, a technology with considerable potential for paleoclimate studies”, Sci. Rep. 7, 1–11 (2017). https://doi.org/10.1038/s41598-017-05437-3
- N.J. McMillan, C. Montoya and W.H. Chesner, “Correlation of limestone beds using laser-induced breakdown spectroscopy and chemometric analysis”, Appl. Optics 51, B213–B222 (2012). https://doi.org/10.1364/AO.51.00B213
- D. Syvilay, B. Bousquet, R. Chapoulie, M. Orange and F.X. Le Bourdonnec, “Advanced statistical analysis of LIBS spectra for the sourcing of obsidian samples”, J. Anal. Atomic Spectrom. 34, 867–873 (2019). https://doi.org/10.1039/C8JA00340H
- K.E. Washburn, J.E. Birdwell and J.E. Howard, “Real-time specific surface area measurement via laser-induced breakdown spectroscopy”, Energ. Fuel. 31, 458–463 (2017). https://doi.org/10.1021/acs.energyfuels.6b02698
- S. Farnsworth-Pinkerton, N.J. McMillan, B.L. Dutrow and D.J. Henry, “Provenance of detrital tourmalines from Proterozoic metasedimentary rocks in the Picuris Mountains, New Mexico, using laser-induced breakdown spectroscopy”, J. Geosci. 63, 193–198 (2018). https://doi.org/10.3190/jgeosci.261
- N. Khajehzadeh, O. Haavisto and L. Koresaar, “On-stream and quantitative mineral identification of tailing slurries using LIBS technique”, Miner. Eng. 98, 101–109 (2016). https://doi.org/10.1016/j.mineng.2016.08.002
- C. Fabre, D. Devismes, S. Moncayo, F. Pelascini, F. Trichard, A. Lecomte, B. Bousquet, J. Cauzid and V. Motto-Ros, “Elemental imaging by laser-induced breakdown spectroscopy for the geological characterization of minerals”, J. Anal. Atomic Spectrom. 33, 1345–1353 (2018). https://doi.org/10.1039/C8JA00048D
- C.J.M. Lawley, A.M. Somers and B.A. Kjarsgaard, “Rapid geochemical imaging of rocks and minerals with handheld laser induced breakdown spectroscopy (LIBS)”, J. Geochem. Explor. 222, 106694 (2021). https://doi.org/10.1016/j.gexplo.2020.106694
- K.A. Kochelek, N.J. McMillan, C.E. McManus and D.L. Daniel, “Provenance determination of sapphires and rubies using laser-induced breakdown spectroscopy and multivariate analysis”, Am. Mineral. 100, 1921–1931 (2015). https://doi.org/10.2138/am-2015-5185
- R.S. Harmon, K.M. Shughrue, J.J. Remus, M.A. Wise, R.R. Hark and L.J. East, “Can the provenance of the conflict minerals columbite and tantalite be ascertained by laser-induced breakdown spectroscopy?”, Anal. Bioanal. Chem. 400, 3377–3382 (2011). https://doi.org/10.1007/s00216-011-5015-2
- M.T. Sweetapple and S. Tassios, “Laser-induced breakdown spectroscopy (LIBS) as a tool for in situ mapping and textural interpretation of lithium in pegmatite minerals”, Am. Mineral. 100, 2141–2151 (2015). https://doi.org/10.2138/am-2015-5165
- W. Nikonow, D. Rammlmair, J.A. Meima and M.C. Schodlok, “Advanced mineral characterization and petrographic analysis by µ-EDXRF, LIBS, HSI and hyperspectral data merging”, Miner. Petrol. 113, 417–431 (2019). https://doi.org/10.1007/s00710-019-00657-z
- M. Gaft, Y. Raichlin, F. Pelascini, G. Panzer and V.M. Ross, “Imaging rare-earth elements in minerals by laser-induced plasma spectroscopy: molecular emission and plasma-induced luminescence”, Spectrochim. Acta B 151, 12–19 (2019).
- K. Rifai, L. Özcan, F.R. Doucet, K. Rhoderick and F. Vidal, “Ultrafast elemental mapping of platinum group elements and mineral identification in platinum-palladium ore using laser induced breakdown spectroscopy”, Minerals 10, 207 (2020). https://doi.org/10.3390/min10030207
- A. Nardecchia, C. Fabre, J. Cauzid, F. Pelascini, V. Motto-Ros and L. Duponchel, “Detection of minor compounds in complex mineral samples from millions of spectra: a new data analysis strategy in LIBS imaging”, Anal. Chim. Acta 1114, 66–73 (2020). https://doi.org/10.1016/j.aca.2020.04.005
- G.S. Senesi, R.S. Harmon and R.R. Hark, “Field-portable and handheld laser-induced breakdown spectroscopy: historical review, current status and future prospects”, Spectrochim. Acta B 175, 106013 (2021). https://doi.org/10.1016/j.sab.2020.106013
- R.S. Harmon, R.R. Hark, C.S. Throckmorton, E.C. Rankey, M.A. Wise, A.M. Somers and L.M. Collins, “Geochemical fingerprinting by handheld laser-induced breakdown spectroscopy”, Geostand. Geoanal. Res. 41, 563–584 (2017). https://doi.org/10.1111/ggr.12175
- R.S. Harmon, C.J. Lawley, J. Watts, C.L. Harraden, A.M. Somers and R.R. Hark, “Laser-induced breakdown spectroscopy—An emerging analytical tool for mineral exploration”, Minerals 9, 718/1–718/45 (2019). https://doi.org/10.3390/min9120718

Giorgio Senesi
Dr Giorgio S. Senesi is a geologist and researcher at National Council Research (CNR), Institute for Plasma Science and Technology (ISTP), Bari. He holds a BA/MS and PhD in Earth Sciences from the University of Bari. Research interests: Laser-Induced Breakdown Spectroscopy applied to minerals, gems, rocks, meteorites, soils, fertilisers, plants and cultural heritage, laser–matter interaction, laser spectroscopy, morphological characterisation techniques (AFM, SEM, TEM) and nanocrystalline diamond films. 0000-0002-3947-6853
[email protected], [email protected]

Russell Harmon
Dr Russell Harmon is a geochemist and an Adjunct Associate Professor in the Department of Marine, Earth, & Atmospheric Sciences at North Carolina State University. He holds a BA from the University of Texas, MS from the Pennsylvania State University and PhD from McMaster University. 0000-0003-1967-3611
[email protected]