Meez Islam,* L. Nitin Seetohul, Noora Qas Nouna, Zuzana Bajuszova and Zulf Ali
School of Science and Engineering, Teeside University, Borough Road, Middlesborough TS1 3BA, UK. E-mail: [email protected]
Introduction
Absorption spectroscopy can be considered to be one of the most useful and also most widely used analytical techniques. One of the reasons for its usefulness and wide use is its experimental simplicity; a typical measurement requires just the intensity of a light source to be recorded with and without a sample. It is also a universal technique in that all analytes absorb somewhere in the electromagnetic spectrum and, further, it is an absolute technique, as an absorption measurement can be used directly to determine a fundamental property of an analyte such as an absorption wavelength-specific molar extinction coefficient, el, through the application of the well-known Beer–Lambert law;
![]()
where I0(l) is the intensity of light reaching the detector in the absence of a sample and I(l) is the intensity transmitted through the sample at a given wavelength, l, C is the concentration of the sample and l is the path length of the sample. Knowledge of el and l allow absorption spectroscopy to be used in a quantitative manner, whilst the wavelength of absorption can be used qualitatively to identify an analyte or functional groups in an analyte. One disadvantage of conventional absorption spectroscopy is its relatively poor sensitivity when compared to other spectroscopic techniques such as fluorescence, which is, typically, more than 103 times more sensitive. This is a consequence of the manner of measurement. Whilst a fluorescence measurement is, typically, made relative to a “zero background”, a small absorption requires accurate discrimination between two large signals. An analogy attributed to the eminent Stanford spectroscopist, Professor R.N. Zare, describes absorption spectroscopy as being similar to determining the weight of a ship’s captain by first measuring the weight of the ship with the captain on board and subtracting from this the weight of the ship alone. From the Beer–Lambert law, it is seen that the absorbance, and thus the sensitivity of measurement, can be improved by increasing the path length. Conventionally, this has been achieved by using either a long physical path length, as in atmospheric measurements such as differential optical absorption spectroscopy (DOAS), where path lengths of several kilometres are used, or by using multi-pass cells such as a White cell or a Herriot cell. In these, segmented gold mirrors are used to multi-pass light, typically 20 times through a cell of a volume >1 L. However, in many experimental set-ups, long physical path lengths are not possible and even the volume of a multi-pass cell is too large.
Cavity-based absorption techniques
Over the past 20 years, new experimental techniques have been developed to increase the path length of measurement for absorption spectroscopy based on the use of an optical cavity. This is usually formed by two concave, high-reflectivity dielectric mirrors, typically separated by distances of 1 m and with reflectivities R ≥ 0.99 (that is 99% or more of the incident light on the mirror is reflected). Light enters the cavity through the back of the first mirror which will have a maximum transmission, T = 1 – R, and undergoes many reflections within the cavity, thus increasing the path length of measurement. The number of passes in the gas phase is given by (1 – R)–1, thus, for R = 0.999 mirrors separated by 1 m, an effective path length of 1 km is obtained in a volume which may only be a few cm3. The first technique to use an optical cavity for absorption measurements was cavity ring-down spectroscopy (CRDS).1 This, typically, requires a pulsed laser light source and a fast sensitive detection system to measure the decay in the intensity of light exiting the cavity (the ring-down time). The change in the ringdown time when an empty cavity is filled with a sample can be used to directly calculate the absorption coefficient of the sample a (a = 2.303 eC). This technique has been widely applied mainly to gas-phase species at wavelengths from the UV to the far-IR and has resulted in improvements in sensitivity of greater than 104 over conventional absorption measurements. It is, however, a complex and expensive technique. A decade after the introduction of CRDS, a variant was proposed which measured the integrated intensity output of the cavity rather than the time-resolved output. This is commonly known as cavity enhanced absorption spectroscopy (CEAS)2,3 and the experimental methodology and data analysis is similar in many ways to conventional absorption spectroscopy, resulting in simpler, less expensive experimental set-ups. A disadvantage compared to CRDS is that calculation of a requires either knowledge of the mirror reflectivities or calibration with a species of known a. The absorption in a CEAS measurement can be expressed as:4
![]()
It can be seen that the increase in sensitivity over a single pass measurement arises from the reflectivity of the mirrors. As with CRDS, CEAS has been widely applied to mainly gas-phase species over a wide range of wavelengths. Both techniques use laser light sources due to the large fraction of light lost after transmission through the cavity, with measurements made either at a single wavelength or scanned over a range of wavelengths when tunable lasers are used.
BBCEAS
A recent innovation in CEAS has been the use of broadband light sources combined with multiplex detectors.5 This has been termed broadband cavity-enhanced absorption spectroscopy (BBCEAS). It allows simultaneous measurement across a range of wavelengths, leading to potential improvements in the signal-to-noise ratio of measurement, although often at the expense of spectral resolution when compared to experiments where the laser wavelength is scanned. The first broadband light source demonstrated was a powerful 2000 W Xe arc lamp which was large, expensive and had high power consumption.5 The author successfully investigated the use of high-intensity light-emitting diodes (LEDs) for BBCEAS, independent of the first reported study in the gas phase by Langridge et al.6 These had the advantage of being small, cheap and having low power consumption (~1 W).
Liquid phase BBCEAS in a cuvette
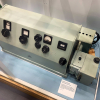
The vast majority of cavity-based absorption studies to date have been performed on gas-phase species, whilst only a handful of studies have been reported on liquid-phase species and even fewer on solids. This is mainly due to the much larger background scattering and absorption losses in the condensed phases which results in fewer passes through the cavity. For liquid-phase studies, where a separate optical element such as a cuvette is placed into the cavity, additional losses are introduced. However, many processes of analytical importance take place in the liquid phase and thus it is important to investigate the feasibility of the cavity-based absorption technique for this phase. Furthermore, BBCEAS is well suited as the ideal cavity technique for the liquid phase as most liquid-phase absorptions are broad and do not require high spectral resolution. The first demonstration of liquid-phase BBCEAS using an LED light source was reported by Islam et al.7 A schematic of the experimental set-up is shown in Figure 1. The output from a Luxeon 1 W LED (white, blue, green or red) was collimated by a series of lenses and irises and passed through an optical cavity formed by two high-reflectivity mirrors separated by a width of 5 cm. A 2 mm path length cuvette was mounted on a rotation stage and placed equidistant between the two mirrors. A zero degree angle of incidence was chosen to minimise scattering and reflection losses from the cuvette. The output from the cavity was focused into the input fibre of a low-cost, compact, charge-coupled device (CCD) spectrograph (Avantes AVS2000) operating in the 200–850 nm range with a spectral resolution of 1.5 nm. The experimental methodology was straightforward and similar to conventional absorption spectroscopy. The cavity absorbance for a given analyte was measured by recording a blank spectrum with just the solvent in the cavity and then the sample spectrum with the analyte added to the solvent, with the absorbance calculated in the usual manner. A single-pass absorption of the analyte at a higher concentration was made in a conventional spectrometer and the single-pass cavity absorption could be calculated by applying the Beer–Lambert law. For small cavity absorptions, it was found that the number of passes in the cavity at a given wavelength or the cavity enhancement factor (CEF) could simply be calculated by;
![]()
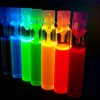
The CEF value was a result of all the cavity losses, including mirror losses and scattering and absorption losses from the solvent and cuvette and, unlike gas-phase measurements, the non-mirror losses were significant. Experiments were performed with R ≥ 0.99, R ≥ 0.9945 and R ≥ 0.999 mirror sets and, due to the high scattering and absorption losses the CEF value, only showed moderate improvements with increasing mirror reflectivity. When combined with reduced light intensity reaching the detector at higher mirror reflectivities, it was found that the most sensitive measurements were, in fact, made with the lowest reflectivity R ≥ 0.99 mirror set. Solutions of the narrow band absorber, Ho3+, the broad absorber, sudan black, and the strong absorber, brilliant blue-R, were chosen as representative analytes. Figure 2 shows cavity spectra of some of the analytes used. The most sensitive results were obtained with brilliant blue-R at 630 nm with a red LED and the R ≥ 0.99 mirror set. A CEF of 51 was calculated, leading to an amin of 5.1 × 10⁻⁵ cm–1 and a limit of detection (LOD) of 6.2 × 10⁻¹⁰ M. These figures were significantly better than conventional single pass absorption measurements and also compared favourably with previous liquid-phase CRDS studies using more complex and expensive set-ups.


Long path BBCEAS measurements in a liquid-filled cavity
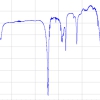
For absorption spectroscopy to compete with the sensitivity of fluorescence measurements, detection, at least at the low pM level, needs to be achieved. In order to make more sensitive liquid-phase BBCEAS measurements, two modifications were made to the previous experimental set-up. First, to eliminate scattering and absorption losses from the cuvette, it was removed and, instead, a specially constructed liquid-tight cavity, where the mirrors were in direct contact with the solution, was used. Second, a longer base path length of 20 cm was used.8 This set-up introduced some new challenges. The enhanced sensitivity resulted in background solvent absorptions, which were insignificant at shorter path lengths, manifesting themselves on sample cavity spectra. These were due to high overtone C–H and O–H stretching vibrations present in most solvents absorbing a significant fraction of light at selected wavelengths under cavity conditions. As a result, preliminary experiments were performed on a range of common solvents and acetonitrile was identified as having the greatest transparency in the range 450–650 nm. The strong absorber, methylene blue, with a peak absorbance at 655 nm, was chosen as the analyte for study. Experiments were performed with a white LED and the R ≥ 0.99 and R ≥ 0.999 mirror sets. Figure 3 shows spectra obtained using the R ≥ 0.99 mirror set. The background solvent absorption at ~620 nm can be clearly seen. The reduced scattering and absorption in the liquid-filled cavity resulted in the CEF value increasing significantly from 78 to 429 when the R ≥ 0.99 mirrors were replaced with the R ≥ 0.999 mirrors. This large increase in effective path length compensated for the decrease in light intensity reaching the detector and the most sensitive results were achieved with the R ≥ 0.999 mirror set. An amin of 2.8 × 10⁻⁷ cm–1 was calculated leading to a LOD of 4.6 × 10⁻¹² M. To date, this appears to be the most sensitive liquid-phase absorption measurement reported in the literature.
")
Application of BBCEAS as a detector for HPLC
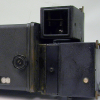
High-performance liquid chromatography (HPLC) typically uses UV-visible absorption detection and has consequently been the focus of the few previous liquid-phase CRDS studies reported. These have all been performed at a single wavelength using complex and expensive experimental set-ups. Our previous BBCEAS studies suggested that BBCEAS would be a suitable detection technique for HPLC, as a result of the multiplex detection used. This was similar in function to the diode array detectors used in modern HPLC systems. Consequently, experiments were performed on a home-built HPLC set-up around which a BBCEAS detection system was built.9 Essentially, a 1 cm path length HPLC flow cell was placed into the optical cavity of a BBCEAS set-up formed using R ≥ 0.99 mirrors. The results were compared with experiments performed on a conventional PerkinElmer Series 200 HPLC instrument. Measurements were made on the dyes rhodamine B and rhodamine 6G. The LODs for the HPLC-BBCEAS instrument were found to be between 54 and 77 times lower than for the conventional HPLC instrument and comparable to the previous HPLC-CRDS studies. A key advantage over single wavelength HPLC-CRDS studies was demonstrated by successfully discriminating between rhodamine B (~556 nm) and rhodamine 6G (~527 nm) when a nearly co-eluting mixture was studied. This is shown in Figure 4. In addition, the simple, low-cost experimental set-up and straightforward data analysis suggested that BBCEAS could be offered as a moderate cost option by HPLC manufacturers.
")
Future applications
The future appears very bright for liquid-phase applications of BBCEAS. In essence, any current set-up which uses single pass absorption spectroscopy on liquids could benefit from enhanced sensitivity if BBCEAS is applied. Current practical challenges stem around the extension of measurements down into the UV region (200–400 nm), where compact, low-cost broadband light sources are rare and suitable broadband high-reflectivity mirrors are difficult to manufacture. Extension into the near infrared region is also desirable but may prove difficult due to increasingly strong background solvent absorptions. Ongoing research at Teesside University is focussing on making UV BBCEAS measurements on liquids and thin films using UV LEDS and also applying BBCEAS to microfluidic devices and microplate readers.
References
- O’Keefe and D.A.G. Deacon, “Cavity ring-down optical spectrometer for absorption measurements using pulsed laser sources”, Rev. Sci. Instrum. 59, 2544 (1988).https://doi.org/10.1063/1.1139895
- R. Engeln, G. Berden, R. Peeters and G. Meijer, “Cavity enhanced absorption and cavity enhanced magnetic rotation spectroscopy”, Rev. Sci. Instrum. 69, 3763 (1998).https://doi.org/10.1063/1.1149176
- A. O’Keefe, “Integrated cavity output analysis of ultra-weak absorption”, Chem. Phys. Lett. 293, 331 (1998).https://doi.org/10.1016/S0009-2614(98)00785-4
- M. Mazurenka, A.J. Orr-Ewing, R. Peverall and G.A.D. Ritchie, ”Cavity ring-down and cavity enhanced spectroscopy using diode lasers”, Annu. Rep. Prog. Chem., Sect. C: Phys. Chem. 101, 100 (2005).
- S.E. Fiedler, A. Hese and A.A. Ruth, “Incoherent broad-band cavity-enhanced absorption spectroscopy”, Chem. Phys. Lett. 371, 284 (2003).https://doi.org/10.1016/S0009-2614(03)00263-X
- S.M. Ball, J.M. Langridge and R.L. Jones, “Broadband cavity enhanced absorption spectroscopy using light emitting diodes”, Chem. Phys. Lett. 398, 68 (2004).https://doi.org/10.1016/j.cplett.2004.08.144
- M. Islam, L.N. Seetohul and Z. Ali, “Liquid-phase broadband cavity-enhanced absorption spectroscopy measurements in a 2 mm cuvette”, Appl. Spectrosc. 61(6), 649 (2007).https://doi.org/10.1366/000370207781269846
- L.N. Seetohul, Z. Ali and M. Islam, “Liquid-phase broadband cavity enhanced absorption spectroscopy (BBCEAS) studies in a 20 cm cell”, Analyst 134(9), 1887 (2009).https://doi.org/10.1039/b907316g
- L.N. Seetohul, Z. Ali and M. Islam, “Broadband cavity enhanced absorption spectroscopy as a detector for HPLC”, Anal. Chem. 81(10), 4106 (2009).https://doi.org/10.1021/ac9004106