John Walton
Surface Analysis Coordinator, School of Materials, The University of Manchester, PO Box 88, Manchester, M60 1QD, UK. E-mail: [email protected], Web: personalpages.manchester.ac.uk/staff/john.walton
Since the interaction between solid materials and their surrounding media, whether gaseous or liquid, occurs at the surface, analytical techniques capable of providing information from the interaction region are fundamental in understanding the processes that are occurring. X-ray Photoelectron Spectroscopy (XPS) is one such technique, and is capable of analysing both conducting and insulating materials.
Introduction
Since the interaction between solid materials and their surrounding media, whether gaseous or liquid, occurs at the surface, analytical techniques capable of providing information from the interaction region are fundamental in understanding the processes that are occurring. X-ray Photoelectron Spectroscopy (XPS) is one such technique, and is capable of analysing both conducting and insulating materials. During analysis, the surface is irradiated by soft X-rays and the energy of the emitted photoelectrons measured. These energies are typically less than 2000 eV; the electrons interact strongly with materials and only those emitted from the top few atomic layers can escape from the surface without energy loss. The energy of these electrons is determined by the atomic number of the emitting element, and is sensitive to changes in the number of electrons in the valence band, so that surface chemical state information is obtained.1
XPS is now a mature technique, the first commercial instruments having become available as long ago as 1969, and judged by the number of scientific publications, it is not only the most popular of the surface analytical techniques, but also the fastest growing. This is due to the fact that it provides relatively easily quantified surface chemical state information. This trend is likely to continue, as instruments capable of operation without expert guidance move from the laboratory to the production line, where they can assist in quality control. Furthermore, developments in data processing have for the first time enabled quantitative surface chemical state images to be produced.2
In spectroscopic mode, improvements in instrumentation resulting in increased energy resolution and sensitivity have led to analysis from smaller areas. The minimum analysis area is now of the order of 10 µm diameter, and so some means of locating this region was required, which led to the development of imaging XPS. The first imaging instrument, the ESCASCOPE3 became available in 1990, and allowed single energy images to be used to locate the region for selected area analysis. Current instruments acquire images with a spatial resolution of about 3 µm either by scanning a focused X-ray probe over the surface, or by maintaining the spatial orientation of the photoelectrons whilst energy filtering them, known as parallel imaging. The latter is the preferred mode of operation, since it allows faster acquisition and minimises sample damage by exposure to X-rays.
Instrumentation
In spectroscopic mode, wide scan spectra are acquired at low energy resolution for quantitative analysis, and photoelectron peak areas compared with relative sensitivity factors. For chemical state determination, high energy resolution spectra are acquired through the photoelectron region of interest, and curve-fitting techniques are often employed to resolve overlapping photoelectron peaks. Recently such instruments have been used to acquire multi-spectral data sets: that is a data set containing a spectrum at each pixel, so that by applying accepted spectroscopic data processing techniques, fully quantitative chemical state microscopy has become a reality. In instruments employing parallel acquisition, this is achieved by acquiring a series of images incremented in energy. A schematic diagram of one such instrument4 is shown in Figure 1. Photoelectrons from the sample, which sits above a magnetic immersion lens, are projected onto the entrance aperture of a spherical mirror energy analyser, and the energy-filtered spatially orientated electrons are amplified and counted by a position sensitive detector. Since the technique is surface sensitive, the instrument is contained under ultra high vacuum. Acquisition of multi-spectral data sets has necessitated characterisation of the instrument in imaging mode5 to establish whether peak positions, line shapes and energy calibration are consistent across the field of view, and also necessitated the development of procedures6,7 to measure the transmission function of the instrument at every pixel for use in quantification.
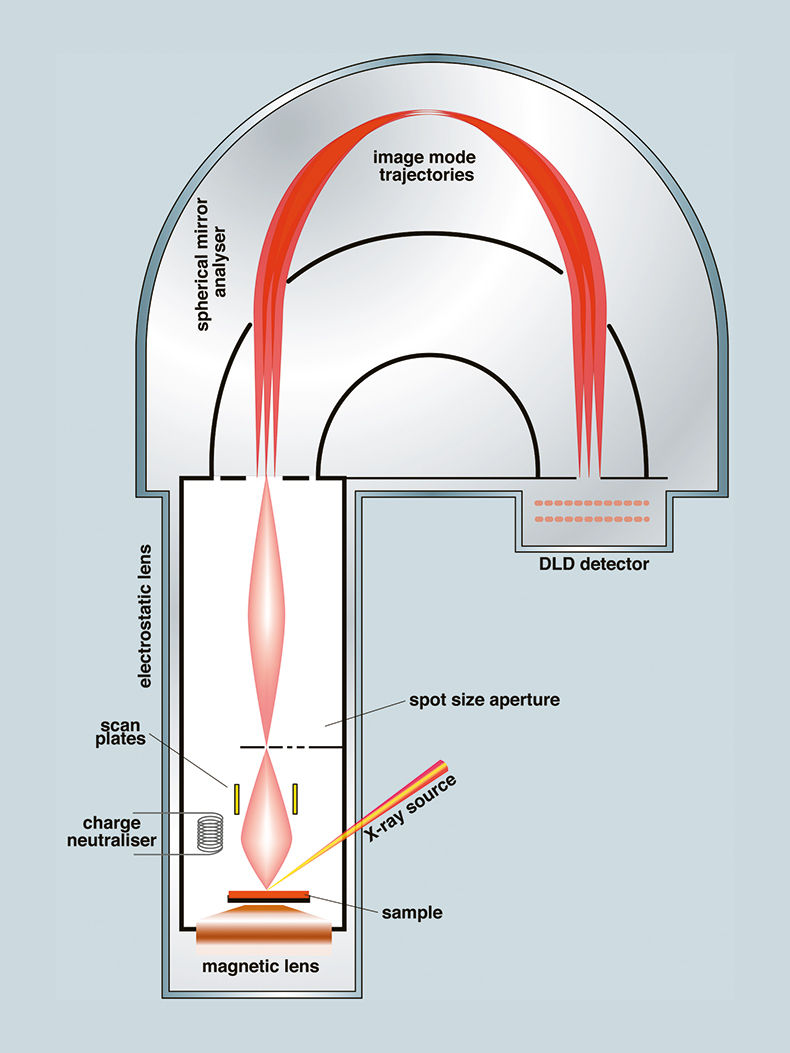
Figure 1. Schematic diagram of a Kratos Axis Ultra XPS instrument operating in imaging mode (courtesy of Kratos Analytical). (DLD: delay line detector.)
Data processing
Such multi-spectral data sets may consist of up to 1000 images, each of 256 × 256 pixels, incremented in energy. Since it is impossible to inspect the 65,536 spectra individually, multivariate analytical techniques8 are used to both reduce the dimensionality of the data, and also to reduce the acquisition time by improving the signal/noise ratio. Principal component analysis (PCA) is widely used for this purpose. It decomposes the data into an orthogonal set of vectors ordered by variance, so that the chemical information may be separated from the noise. However, PCA is computationally intensive and Non-linear Iterative Partial Least Squares (NIPALS) is used in preference. The NIPALS procedure decomposes the data sequentially into abstract factors, and since there are many fewer components in such an XPS data set than there are images, terminating the procedure when sufficient factors have been calculated leads to a significant reduction in computational requirements. In practice, a few more factors are calculated so that the number required to reconstruct the data may be determined. The data is usually filtered prior to decomposition, since the noise in pulse counting instruments is Poissonian, which is proportional to the square root of the signal intensity; PCA requires that the noise is evenly distributed.
Analysis
In imaging mode, as in spectroscopic mode, data may be acquired for quantification of the elements present at the surface, and for chemical state determination. In Figure 2, an example of chemical state analysis of the degradation of a microchannel plate is shown; examples of elemental quantification are provided elsewhere.9 Spots of corrosion could be observed on the microchannel plate, which when inspected using an optical microscope, Figure 2 (a), appeared to be surrounded by a circular region. XPS analysis was carried out by acquiring 850 and 350 images, incremented by 0.1 eV in energy, through the O 1s and C 1s photoelectron regions, respectively, at high energy resolution, with 30 s dwell time per image, and from a 800 µm × 800 µm field of view. All data processing was undertaken using CasaXPS.10 The noise in the data was reduced by reconstructing the data set using the first three image abstract factors. Figure 2 (b) shows the second image abstract factor and a false colour image following classification of the pixels by intensity. Classification in this way orders the data by chemistry, which may be due to changes in peak intensities, changes in peak position caused by chemical shifts, or changes in the inelastic background caused by in-depth inhomogeneity. This allows curve fit models to be produced, which are a close approximation to the spectra to which they will be applied. The O 1s and C 1s spectral regions belonging to each classification have been summed, and curve fitting carried out, Figure 2(c). Chemical state assignments are then made based on the chemical shift from the C–C, C–H peak. The results of the curve fitting were then applied to all the spectra within their own classification only, to produce chemical state images. The validity of the curve fitting may be checked by inspecting a figure of merit composed of the root mean square deviation between the curve fit envelope and the data at each pixel in the image, normalised to the sum of the curve fit intensities. In this way, increases in intensity across the field of view indicate a poorer fit, and the spectra concerned may be examined, and the curve fitting corrected. The results are shown in Figure 3, where peaks O2 and C4 [see Figure 2(c)], assigned as oxygen and carbon, respectively, in carbonate species, and Na are shown to correspond to the entire circular region and not just the central corrosion product. This association would not have been possible to make conclusively using selected area analysis. It is known that enrichment of sodium occurs at the surface of microchannel plates during operation, and so it was concluded that degradation was due to sodium reacting with an aerosol droplet to form a hydroxide, which then absorbed CO2 from the ambient. The larger corrosion feature developed at a later date.
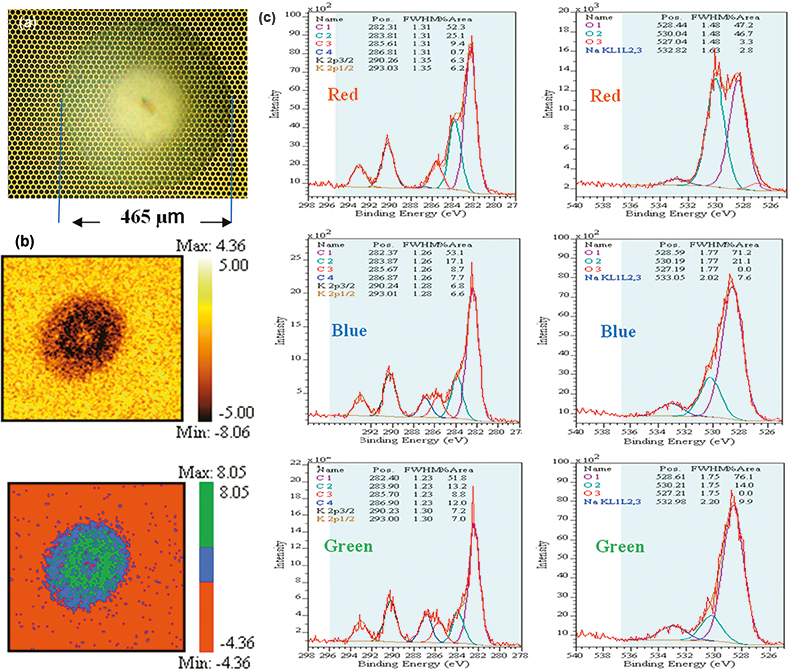
Figure 2. Imaging XPS analysis of the degradation of a microchannel plate. (a) Optical micrograph, (b) second image abstract factor, and its false colour image following pixel classification (800 µm × 800 µm field of view), (c) curve fitting to the C 1s and O 1s photoelectron spectra summed within each classification. Reprinted with permission from J. Walton, “Aerosol damage to a microchannel plate analysed by X-ray photoelectron spectromicroscopy”, Surf. Interface Anal. 39, 337–342 (2007). John Wiley & Sons Ltd, Chichester. Published: Online 13th November 2006 in Wiley Interscience.
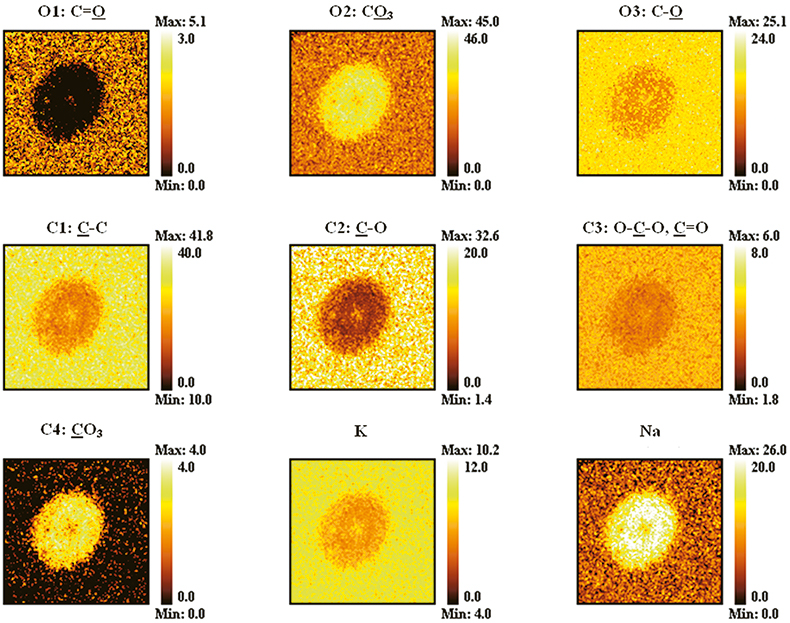
Figure 3. Chemical state images produced by applying the curve fit models of Figure 2 (c) to the spectra within their own classification. (800 µm × 800 µm field of view). Reprinted with permission from J. Walton, “Aerosol damage to a microchannel plate analysed by X-ray photoelectron spectromicroscopy”, Surf. Interface Anal. 39, 337–342 (2007). John Wiley & Sons Ltd, Chichester. Published: Online 13th November 2006 in Wiley Interscience.
Classification of pixels in both atomic concentration images and image abstract factors may also be used to aid visualisation of wide scan spectra without recourse to multivariate curve resolution and its attendant uncertainties.9
Future developments
In future, as quantitative imaging becomes more widespread, improvements in lens and analyser design will lead to increased spatial resolution and sensitivity. Improvements in multivariate analytical techniques may eliminate the need to scale the data, and parallelisation could be used to speed computationally intensive procedures such as curve fitting. Attempts have already been made to provide in-depth analysis within images,11–13 and given the demand for nano-structural analysis, may be expected to continue.
References
- For a detailed explanation, see D. Briggs and J.T. Grant (Eds), Surface Analysis by Auger and X-ray Photoelectron Spectroscopy. IM Publications, Chichester, UK and SurfaceSpectra, Manchester, UK (2003).
- J. Walton and N. Fairley, Surf. Interface Anal. 36, 89 (2004).
- XPS is also known as ESCA, Electron Spectroscopy for Chemical Analysis.
- Kratos Analytical, Manchester, UK. www.kratos.com
- J. Walton and N. Fairley, Surf. Interface Anal. 38, 1230 (2006).
- J. Walton and N. Fairley, J. Electron Spectrosc. Relat. Phenom. 150, 15 (2006).
- J. Walton and N. Fairley, Surf. Interface Anal. 38, 388 (2006).
- For more information, see E.R. Malinowski, Factor Analysis in Chemistry, 3rd Edn. John Wiley & Sons, New York (2002).
- J. Walton and N. Fairley, Proceedings of ECASIA’07 (Vienna, 2007) to be published in Surf. Interface Anal.
- Casa Software Ltd, Teignmouth, Devon, UK. www.casaxps.com
- J. Walton and N. Fairley, J. Electron Spectrosc. Relat. Phenom. 148, 29 (2005).
- E.F. Smith, D. Briggs and N. Fairley, Surf. Interface Anal. 38, 69 (2006).
- S. Hajati, S. Coultas, C. Blomfield and S. Tougaard, Surf. Sci. 600, 3015 (2006).