
Kim H. Esbensen
KHE Consulting, Denmark. E-mail: [email protected]
Adjunct professor, Aalborg University (AAU), Denmark; Adjunct professor, Geological Survey of Denmark and Greenland (GEUS); Assoc. Professor, Université du Québec à Chicoutimi (UQAC), Quebec; Guest professor (2018) Recinto Universitario de Mayaguez, Puerto Rico; Guest professor (2018) University College of Southeast Norway (HSN)
DOI: https://doi.org/10.1255/sew.2018.a3
© 2018 Spectroscopy Europe
This is a tale of two fictional commercial laboratories, but all features in the story represent true events and occurrences culled from a range of real-world laboratories, here re-arranged in a more focused fashion for a purpose: “How can the Theory of Sampling (TOS) help the commercial laboratory to improve its reputation and to increase its business”? The relevance for existing laboratories is striking. The reader will have to bear with the column for mostly focusing on sampling issues in what obviously is a much more complex scientific and business context, but please indulge us for a little while—there is a sharp return to real-world realities at the end of the story. Laboratory A is in fierce market competition with Laboratory B (and indeed several others in the global market), a situation that has existed for decades. This has so far led to a healthy business-oriented science, technology and human capital drive that has served both laboratories well. Both laboratories are also keenly aware of the necessity to be in command of TOS for all relevant in-house activities involving sampling, sub-sampling, mass-reduction, sample splitting etc. But whereas Laboratory A has availed itself of the services of TOS strictly within its regimen only (as is indeed the case for most laboratories), one fine day the manager of Laboratory B had an epiphany that made her see the potential advantages of applying TOS in full, which involved a distinctly “beyond-the-laboratory” scope. What happed on that fine day? And how did it help Laboratory B to do better in the market?
Disclaimer. There is no identifiable, real-world laboratory that corresponds completely to Laboratory A; it is for the tale’s convenience that individual features met with in a large swath in real world laboratories have been collected under this generic name. Thus, Laboratory A mostly exists as a collection of issues, some of which may happen to also characterise the reader’s laboratory, while Laboratory B is of an altogether different nature. Laboratory B is an emerging entity, on the verge to become real ….
Introduction (scientific, technological)
The traditional view of the role, tasks and responsibilities of the analytical laboratory is well described by Laitinen in an Editorial in Analytical Chemistry in 1979.1 Despite being written 40 years ago, this is still an apt summary of the workings, and frustrations, of laboratory life. The emphasis on lack of communication between stakeholders is probably still true today. The only flag-raiser is hidden in the following sentence: “… the analyst chemist is frustrated … not being informed about the full background of the sample, its urgency, or the use to which the measurements will be put” (emphasis by the current author). Based upon the body of knowledge presented in all previous Sampling Columns, it is obvious that the analytical laboratory is an important area for application of the Theory of Sampling (TOS). There is so much essential sub-sampling going on, and there are many aspects of sample preparation and presentation that involve elements of mass-reduction as well (which is also sampling).
Of course, analytical chemistry reigns supreme in the laboratory. Full, always updated, command of the science and technology of analytical chemistry is the raison d’etre for all analytical laboratories, research or commercial. However, proper sampling also plays a critical role, as has been made abundantly clear in the previous columns in their treatment of why? and how? to sample. It is indeed fully possible to make a complete mess of the internal mass-reduction pathway towards analysis with severe, often fatal, breaks with representativity if the elements of the ongoing sub-sampling are not in compliance with the stipulations in TOS. The problem has been, and still is, that such operations are traditionally viewed as but “trivial” mechanical parts of the analytical process, and consequently have only rarely, if at all, been viewed in a systematic fashion—enter TOS. The present tale revolves around these issues.2
There is analysis … and there is analysis+
As soon as samples have been delivered to the in-door of an analytical laboratory, sub-sampling is in fact the critical success factor that must be dealt with in a proper fashion in order to be able to document relevant, reliable, representative analytical results.3,4 This is a subtlety often not fully acknowledged, or even recognised, in the flurry of business and economic calculations taking the driver’s seat in the laboratory. It is all too often assumed that all operations and facilities needed for proper analysis are fully known and tested in the operative realm: procedures, equipment, work-paths, training—for which reason laboratory efficiency is considered only within the narrow scope of organising and optimising the total complex workflow. Truth be told, this is far from a simple matter in practice, but this is exactly where good managers have the opportunity to shine. However, in this managerial view, the elements in all analytical workflows are fixed and fully optimised, so that sample throughput comes into focus as the key factor of interest. Such elements are sample receiving, initial sample preparation, sub-sampling, possible sending off of sub-samples to other within-company laboratories for other types of analysis, more sample preparation (this time for analytical support), e.g. grinding, milling, mixing, sieving, analyte extraction (for some types of analysis only) and many other specialised part-operations where/when needed. The key point here is that all these elements are considered as objects that can, indeed should, be managed exclusively according to a flow-path business objective with the aim of producing the necessary economic profit.
Call this position “Laboratory A” in this tale. It is likely a fair statement that this is the main business strategy behind most of today’s commercial analytical laboratories. But under normal market conditions profit will not sky-rocket for Laboratory A as a function of even the best manager’s efforts, because of the relentless market competition with (many) other commercial laboratories. For the time being, this is the same basis upon which Laboratory B is in business as well.
Thus, at the outset, Laboratories A and B are competing on what economists call a fair basis; both have competent managers and highly competent technical staff (scientists, technicians …), superior logistics and they both have access to the same external (public domain) scientific and technological facilities and developments with which to sustain their current business and, hopefully, improve their state-of-the-art capabilities, and thereby be able to drive their individual businesses forward. So how is it possible for an individual laboratory to increase its market share? Better marketing and better presence in the market are the first business-related options with which to promote its potentially better offerings. The archetypal answer in a high-tech context is either by becoming more efficient than competing companies and/or through being the first mover with respect to significant technological developments, perhaps even disruptive technological breakthroughs. Both laboratories will, in principle, have equal access to all developments which are published as a result of university R&D, but it is possible that the ability to spot what may become could be different in the two laboratories. Also, much of analytical technological development takes place in the laboratory regimen, and here it’s everybody’s game. However, the present tale is not about possible new technological drives or potential comparative advantages, far from it. The core element in this tale has been around for more than 60 years, and could thus not possibly contend with modern, disruptive technology breakthroughs—or could it?
The core issue
The core issue turned out to develop into a marked difference, which only Laboratory B decided to take advantage of. At its root, it is based on the in-depth understanding (“technical” understanding, if you will) that stems from TOS:
“The quality and relevance of an analytical result is not only a function of the analytical competence, analytical equipment, work-path optimisation, i.e. the traditional business understanding which is the firm position for Laboratory A. It is equally as much a function of the specific sampling procedures a.o. involved in producing the analytical aliquot.”2–5
Thus, while precision is a quality characteristic of the analytical method, and while the analytical accuracy refers to the mass that has actually been analysed only, i.e. to the mass of the aliquot, this is not in compliance with the needs of the users of analytical results, the clients of the laboratory. Users will invariably make important decisions (sometimes trivial decisions, at other times truly critical decisions, sometimes even life-and-death decisions in science, technology, industry and society) based on the reliability of the analytical results. In an overwhelming proportion of cases this is tantamount to the reputation of the analytical laboratory, be this a commercial or an in-house technical laboratory. Indeed, the specific analytical quality and performance characteristics are in the centre focus for all kinds of official or commercial auditing, accreditation and certification of laboratories (CEN, ISO, JORC etc.). The present tale focuses on the fact that all of the above demands are declared as satisfactory as long as the analytical accuracy and precision meet up with relevant criteria.
But the core issue of the tale constitutes a different scope. The practical user perspective is the original lot, not the analytical aliquot. Enter the critical factor of how the enormous gulf between lot and aliquot has been bridged. This has everything to do with the ability to comply with TOS in all stages of the pathway from-lot-to-aliquot, Figure 1.
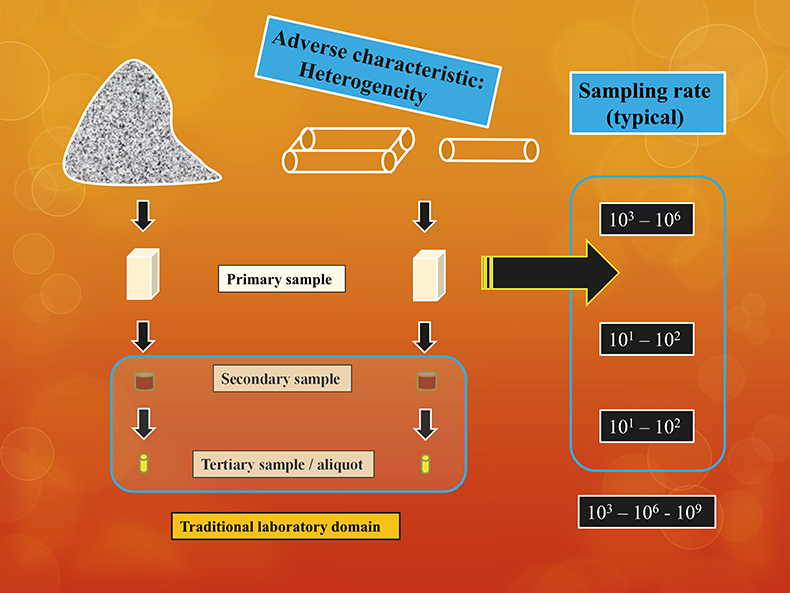
Figure 1. The common from-lot-to-aliquot pathway encompasses sampling processes which are in no way simple mass-reductions, but which require complete compliance with TOS at all sampling stages.
The crux of the matter
The user who is to make critical decisions does not care one iota how accurate a specific analytical method is w.r.t. the miniscule analytical mass! The decision maker is only concerned with how accurate a particular analytical result is (say, 3.57 % or 276 ppm) with respect to the original lot. The operative question for all users is: “how accurate is this compositional determination with respect to the original lot?”. How can I be certain this is a determination that holds up w.r.t. the 1000-to-100,000 times larger original lot? What is the uncertainty related to the analytical result in this context? This focus is very real and leads to the above questions which need definite answers.
But the way clients and laboratories traditionally go about this issue lacks relevance and rigour. The tradition is to point to, and rely on, official laboratory accreditations, performance diplomas etc. But this kind of validation, verification and justification is exclusively based on the narrow analytical accuracy and precision characteristics only—which are all based on the aliquot.
However, the analytical aliquot mass/volume is very far away from the legitimate practical concern, the lot. The analytical aliquot is typically (on a mass/mass basis) some 103, 106 (or more) times smaller than the lot. The critical success factor of all analysis is, therefore, that the complete, multi-stage sampling process spanning a mass reduction of 1/100,000 or more, preceding analysis, is scrupulously representative. How else could the analytical result of the aliquot say anything meaningful about the composition of the entire lot? The only available guarantee for representativity (simultaneous accuracy and precision relevance w.r.t. the lot) is the specific sampling process used to cover these three to six (or more) orders-of-magnitude of mass reduction before analysis. From TOS it is known that it is only a specific, documentable sampling process that can be evaluated, assessed and declared to be representative, or not.a
“What is the nature of the accuracy and precision estimates quoted in all of this world’s analytical laboratory accreditations?3”
While there quite understandably may well be great pride in the analytical capabilities of a(ny) specific analytical laboratory … the relevant decision-making issue, relevant for the user of analytical results, is overwhelmingly missing from current analytical reports, diplomas and certifications.3 This is a harsh statement, but nevertheless true.b Mostly, an estimate of the operative, real-world decision-making accuracy w.r.t. the original lot is nowhere to be found, very likely because covering this would entail that the laboratory should be involved with all sampling going on, specifically also that associated with the primary sampling from the lot.3–5 This would require the laboratory to be(come) fully TOS competent (see all earlier columns in this series); a graphic summary of this body of knowledge is given in Figure 2. Here is the problem ….
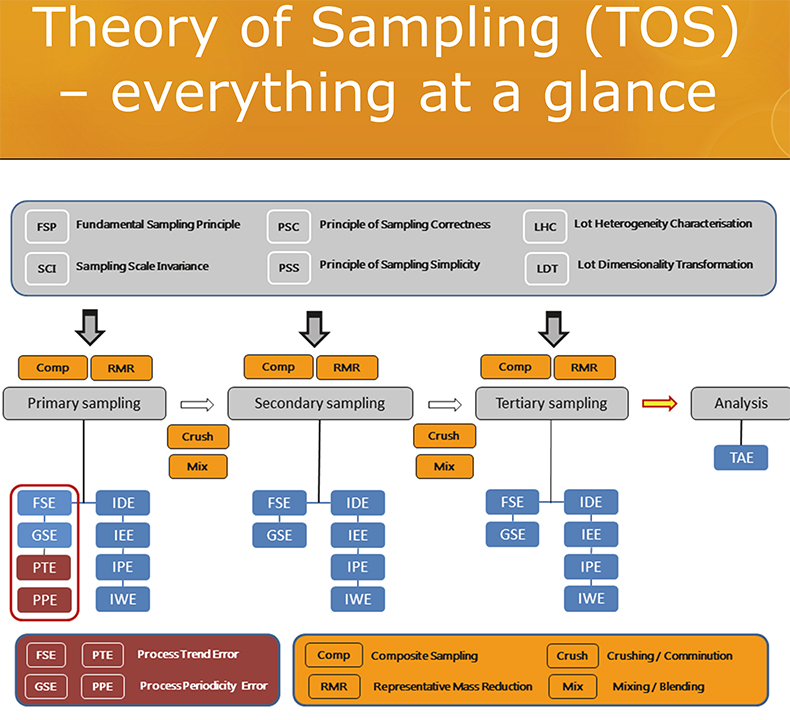
Figure 2. The most updated summary of the Theory of Sampling (TOS), the elements of which are comprised by six Governing Principles (GP, grey), four Sampling Unit Operations (SUP, yellow) and six (eight) sampling errors (blue, maroon) and their processual relationships w.r.t. the multi-staged sampling process “from-lot-to-aliquot”. See TOS references below for in-depth description.2–10 Illustration copyright KHE Consulting; reproduced with permission.
The complete argument
There are always several possible different sampling methods that can be used in a particular situation, at a particular scale—first and foremost grab sampling vs composite sampling,12,13 or composite sampling based on a significantly different number of increments vis-à-vis the lot heterogeneity addressed. In the case of, typically, three stages of sampling and sub-sampling in the laboratory, there are many possibilities for coming up with functionally different sampling pathways from-lot-to-aliquot. All will lead to an analytical aliquot, but the analytical results will per force be different because of lot heterogeneity, it is only a matter of the degree of successful heterogeneity countermeasures embedded in the actual sub-sampling processes, and the way these address the various manifestations of material heterogeneity met with at particular sampling stages. Thus, in a very real sense the specific sampling pathway will influence the analytical results—an aliquot is not just an aliquot that can be dealt with in isolation, all aliquots have a past, a provenance.
Thus, a fundamental tenet stemming from TOS is that all analytical results are but estimates of the composition of the original lot. Hopefully the best possible estimate of course, but “best” is not an automatic qualifier. “Best” specifically means, and should only mean, that the analytical report reflects the singular representative analytical result that directly can be used for the important societal, corporate, environmental decision-making. Which again brings forth the key understanding that the qualifier “representative” is related to the perspective of the complete sampling process “from-lot-to-aliquot-to-analysis”, not to the infinitely smaller foray “from-aliquot-to analysis” only. This is an understanding that must not be subjugated the flurry of narrow economic, optimising activities ... It matters, crucially, how the analytical aliquot was arrived at.2–10 All laboratories must be sufficiently TOS competent.
In fact, it is fully possible to make use of bona fide analytical methods (likely with extremely good analytical accuracy and precision), which in the absence of a preceding representative sampling process, will have the quirky characteristic of delivering analytical results that are “precisely wrong”. This surprising understanding concerns the fundamentally different nature of the analytical vs the sampling + analytical bias, an issue which has featured extensively in recent TOS literature.3–6 Figure 3 depicts this crucial distinction graphically.
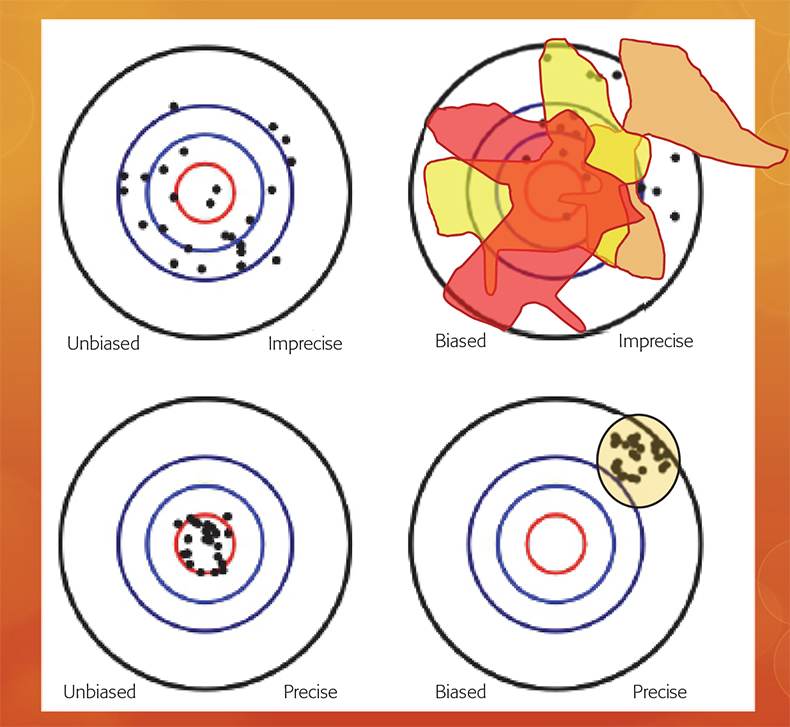
Figure 3. While an analytical bias can always be subject to a statistical bias-correction (lower panels), the nature of the sampling + analytical bias is fundamentally different (upper panels).3 Because of the interaction between a specific material heterogeneity and a specific sampling process, which may be more-or-less removed from the qualifier “representativity”, replicated sampling + analysis will always result in a different accuracy and precision estimate; the sampling + analysis bias is inconstant.3.
The meaning of it all
From TOS, e.g. the sampling standard DS 3077 (2013)4 (or all earlier Sampling Columns5), it is well known that the uncertainty stemming from a preceding sampling stage is on average some 10× larger.c Thus, if not TOS compliant, the sampling error uncertainty stemming from the primary sampling stage operations is on average 10× larger than those originating at the secondary sampling stage (and may be even larger, depending on the material heterogeneity and the degree with which sampling errors have been adequately eliminated and/or suppressed, or not) …, which again is 10× larger than those pertaining to the tertiary sampling stage, the aliquot-producing stage (very often effected by a grab sampling spatula). These are but general order-of-magnitude factors. Materials will exist whose inherent heterogeneities would lead to somewhat smaller factors, but there just as assuredly also will exist materials with a much more troublesome heterogeneity, which would lead to larger-than factors of 10×. Finally, in general, sampling errors always greatly exceed the specific analytical uncertainty (termed the total analytical error, TAE).
What appears to be the saving grace is that all the world’s laboratories can safely be assumed to have minimised their within-house analytical uncertainties to the highest possible standard which, alas, is but a very small fraction of TSE. Thus, the core message from TOS’ experience is that there is a step-up, potentially up to several orders-of-magnitude, as concerns the sampling uncertainty accumulated over all effective sampling stages (the total sampling error, TSE), in the absence of any specific heterogeneity counteraction. This counteraction is the raison d’etre for TOS. Either way, TSE always dominates TAE, occasionally to such a degree that TAE dwindles into oblivion. The point is that a situation very rarely exists in which TAE is close to TSE in magnitude. When such is the case, this would signify a laboratory truly very much in the lead, because all sampling errors would have been completely minimised. But how would a laboratory go about proving this? A survey of reputable analytical laboratory homepages is very telling, mostly because of a certain sin-of-omission regarding estimates of the effective TSE accumulated over all sampling stages.
Inside and outside the complacent four walls of the analytical laboratory
But the real culprit, the core issue of this tale, would still not have been addressed, because this lies outside the traditional laboratory regimen. The somewhat uncomfortable summary effect of all of the above is that the primary sampling stage very nearly always dominates TSE all by itself. But this is almost never included in laboratory performance reports. Why?
And, where did primary sampling arise from all of a sudden? Why is this critical?
For two reasons:
- Due to market competition, the responsible analytical laboratory will always tend to have the smallest possible residual uncertainty from all the operative steps involved in its many different analytical offerings to its clients. For fully responsible laboratories this includes a genuine focus on minimising the tertiary and often also secondary in-house sampling (in reality sub-sampling in relation to the not-yet-included primary sampling from the lot). This aspect is what will differentiate between individual real-world laboratories, which may decide differently as to what degree to also venture outside the laboratory when full TOS optimisation is wanted.
- The second reason why TSE very nearly always dominates the total uncertainty budget [TSE + TAE] is that Laboratory A deliberately declares: “Primary sampling is outside our responsibility”. This is the hidden elephant in the room. Analytical laboratories may, or may not, deliberately consider that all ex-laboratory issues per definition are irrelevant—while the reality for users of the analytical results is completely dominated by the contribution from this “missing link”. This issue is actually the only discriminating issue between the generic Laboratory A and Laboratory B.
What happened to generate this potential difference?
“One fine day” …
“One fine day” the manager of Laboratory B called in at work consumed with a completely new attitude, based on an epiphany she had had in her dreams the night before. Barely in the door, calling an immediate board and section chiefs meeting, the manager declared (eyes shining with newfound righteousness):
“There is a completely unrecognised business opportunity that no other laboratory has tapped into … yet. Laboratory B must be the first mover, Laboratory B must be the first to reap this competitive advantage! It has dawned upon me that despite Laboratory B’s most stringent efforts to curtail all total in-house errors, we have erred, believing that this was well summarised by TAE … We have erred grossly! It is in reality [TSE + TAE] that is accountable for all the real-world’s ‘analytical variance’. It has dawned upon me that we are at least a factor 10× too low in our declarations in our analytical certificates—and depending upon the heterogeneity of lot materials and the ability to follow TOS, this factor could be higher!’ (the manager shuddered visibly). ‘What’s more—today we have absolutely no, or only very little, possibility to influence this issue since this problem originates with/at the primary sampling from the original lot, which this laboratory so far has declared to be exclusively the responsibility of the client. How often does our Laboratory B, which we like to call ‘the leading laboratory in the world’, insist that it is in fact also our responsibility to explain to clients that this is a problem of significantly larger impact with respect to the interpretability of the analytical results in context than any other? A factor of 10+ or larger.”
Taking a step back, the writer of this column, who has visited, audited and consulted with scores of analytical laboratories during a long professional career, offers a quantitative comment on the side: laboratories that do not care about the issue surrounding primary sampling errors and their inflationary impact on the total uncertainty budget, the proverbial Laboratory A, unfortunately dominates the field. Hardly one Laboratory B exists today—but there could very well be one tomorrow!
The above account, actually not a tale at all, has gone to great efforts to explain the “technical” TOS-based evidence for the situation revealed: as long as virtually no-one still does not take primary sampling sufficiently serious (neither clients, nor laboratories), this should rightly be called the primary sampling disaster! As long as this has not happened, what are the consequences?
They are numerous, and they concern both company bottom lines and laboratory efficiency, i.e. direct economic negative outcomes. They also concern the possibilities for necessary and efficient societal and public regulation and control (e.g. food, feed, pharmaceutical drugs, public health), and here with likely much larger negative economic impacts, although often hidden at first sight.14 And they concern the reputation of the analytical science, technology and trade—which in the end reflects on the reputation of each individual analytical laboratory (commercial or not).
The really important aspect: costs or gains
Could there really be direct economic and business advantages in taking on the primary sampling issue—an issue so long considered as not our laboratory’s responsibility? The most often heard “justification” used in this context (remember that every single feature in this constructed tale is true …) is:
“This laboratory need not concern itself with primary sampling .... This will cost us additional work, man hours, expenditures. This will break up our established work paths—all of which will impact negatively on our bottom line. And we will especially not be involved in this matter, since none of our competitors take this up either—we would simply be losing money in-house, and to no business advantage!”
The world’s laboratories, clan A, have spoken!
This is the status quo in a large segment of the commercial analytical laboratory realm.
Nevertheless, Laboratory B decided to be the first mover and to proceed down this new road.
What in the world?
What was the epiphany experienced by the manager of what became: Laboratory A → Laboratory B?
- What was the business argument that negated the above justification for doing nothing, for continuing exactly as before—for continuing exactly as all the other, competing laboratories?
- What will it take to seize the day?
- Will your laboratory become Laboratory B tomorrow?
The following proverb is attributed to the founder of the Theory of Sampling (TOS) Pierre Gy.15 Think of this in relation to the dominating primary sampling error/uncertainty!
“SAMPLING – is not gambling!” Pierre Gy (1924—2015)
One may also factor in a well-known contradiction regarding human capital management:
“CFO asks CEO: ‘What happens if we invest in developing our people and then they all leave us?’
CEO: ‘What happens if we don’t, and they stay?’”—Anon
What was the epiphany all about? Find out in the next issue!
Footnotes
- It is not possible to subject “representativeness” to grammatical declination—a sampling process either is representative, or it is not…
- To the reader who has already understood the point of this tale, there only remains to refer to the earlier Sampling Column which dealt with the “Replication Experiment”.11
- The relationships between sampling—and analytical errors and their effects on Measurement Uncertainty (MU) is treated in a benchmark paper in great detail; interested readers are referred to Reference 3.
References
- H.T. Laitinen, “The role of the analytical laboratory”, Anal. Chem. 51(11), 1601 (1979). doi: https://doi.org/10.1021/ac50047a600
- K.H. Esbensen and C. Wagner, “Why we need the Theory of Sampling”, The Analytical Scientist 21, 30–38 (2014).
- K.H. Esbensen and C. Wagner, “Theory of Sampling (TOS) versus Measurement Uncertainty (MU)—a call for integration”, Trends Anal. Chem. (TrAC) 57, 93–106 (2014). doi: https://doi.org/10.1016/j.trac.2014.02.007
- DS 3077. Representative Sampling—Horizontal Standard. Danish Standards (2013). www.ds.dk
- Sampling Columns: an entry-level introduction to the theory and practise of sampling. https://www.spectroscopyeurope.com/sampling
- K.H. Esbensen, C. Paoletti and N. Theix (Eds), J. AOAC Int., Special Guest Editor Section (SGE): Sampling for Food and Feed Materials, 98(2), 249–320 (2015) http://ingentaconnect.com/content/aoac/jaoac/2015/00000098/00000002
- K.H. Esbensen, C. Paoletti and P. Minkkinen, “Representative sampling of large kernel lots – I. Theory of Sampling and variographic analysis”, Trends Anal Chem. (TrAC) 32, 154–165 (2012). doi: https://doi.org/10.1016/j.trac.2011.09.008
- P. Minkkinen, K.H. Esbensen and C. Paoletti, “Representative sampling of large kernel lots – II. Application to soybean sampling for GMO control”, Trends in Anal. Chem. (TrAC) 32, 166–178 (2012). doi: https://doi.org/10.1016/j.trac.2011.12.001
- K.H. Esbensen, C. Paoletti and P. Minkkinen, “Representative sampling of large kernel lots – III. General Considerations on sampling heterogeneous foods”, Trends in Anal. Chem. (TrAC) 32, 179–184 (2012). doi: https://doi.org/10.1016/j.trac.2011.12.002
- K.H. Esbensen and P. Paasch-Mortensen, “Process sampling (Theory of Sampling, TOS)—the missing link in process analytical technology (PAT)”, in Process Analytical Technology, 2nd Edn, Ed by K.A. Bakeev. Wiley, pp. 37–80 (2010). doi: https://doi.org/10.1002/9780470689592.ch3
- K.H. Esbensen and C. Wagner, “Sampling quality assessment: the replication experiment”, Spectrosc. Europe 28(1), 20–25 (2016). https://www.spectroscopyeurope.com/sampling/sampling-quality-assessment-replication-experiment
- K.H. Esbensen and C. Wagner, “Composite sampling I: the Fundamental Sampling Principle“, Spectrosc. Europe 27(5), 18–21 (2015). https://www.spectroscopyeurope.com/sampling/composite-sampling-i-fundamental-sampling-principle
- K.H. Esbensen and C. Wagner, “Composite sampling II: lot dimensionality transformation“, Spectrosc. Europe 27(6), 21–24 (2015). https://www.spectroscopyeurope.com/sampling/composite-sampling-ii-lot-dimensionality-transformation
- C. Paoletti and K.H. Esbensen, “Representative sampling and society”, Spectrosc. Europe 30(3), 18–21 (2018). https://www.spectroscopyeurope.com/sampling/representative-sampling-and-society
- K.H. Esbensen, “Pierre Gy (1924–2015): the key concept of sampling errors”, Spectrosc. Europe 30(4), 25–28 (2018). https://www.spectroscopyeurope.com/sampling/pierre-gy-1924%E2%80%932015-key-concept-sampling-errors
