Nicolas C. Polfer
Department of Chemistry, University of Florida, PO Box 117200, Gainesville, FL 32611-7200, United States. E-mail: [email protected]
Introduction
As an analytical technique, mass spectrometry excels by its high sensitivity, its ability to analyse mixtures and its high throughput capabilities. Nonetheless, while knowledge of the elemental composition of an unknown analyte (by virtue of accurate mass measurement) is an important piece of information, it generally does not allow an unambiguous identification. A mass measurement lacks the chemical specificity of a spectroscopic measurement.
Infrared ion spectroscopy combines the separation capabilities of mass spectrometry with the structural information from infrared spectroscopy. Figure 1 illustrates how infrared ion spectroscopy is implemented in terms of instrumentation. Gas-phase ions M+ are generated by ionisation, in this case electrospray ionisation. Electrospray ionisation is one of the softest ionisation methods that allows intact molecules to be transferred from solution to the gas phase via evaporation from droplets. Ions are then generally accumulated and stored in an ion trap, which is a highly versatile device. Here, ions can be mass isolated, so that only masses of interest are retained, while all other ions are discarded. An ion trap also conveniently focuses ions in space, so that they can be irradiated with a photon source. The purpose of irradiation is to induce photodissociation, which manifests itself as a change in mass-to-charge (m/z). This can be ascertained by measuring the mass spectrum after irradiation. Using a tuneable light source, the photodissociation of an ion can be probed as a function of photon frequency. This is illustrated for the non-covalent complex M+•Tag, and here more specifically for PABA•CH3CN (para-aminobenzoic acid complexed with acetonitrile) at m/z 180, which dissociates to bare PABA at m/z 138. The complex dissociates at some infrared frequencies, but not at others, which is related to the vibrational modes of the complex. The photodissociation yield as a function of infrared frequency is thus an indirect measure of the inherent infrared spectrum of the ion. This is a so-called “action” spectroscopy approach, where changes in the absorbing species are measured, as opposed to an absorption approach, where changes in light intensities are measured. It should be noted that the “action” spectroscopy approach is vastly more sensitive, as the number of ions in a mass spectrometer is generally too low for absorbance measurements. It also follows that ion spectroscopy has high sensitivity, because of the high sensitivity of mass spectrometry, even if scanning the infrared frequency may take time, and thus consume more sample.
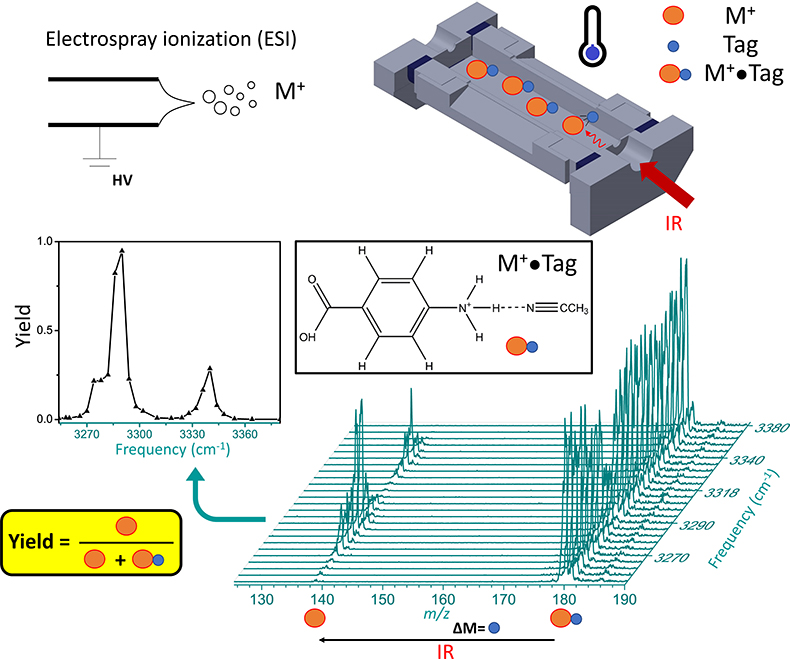
Figure 1. Schematic showing ionisation of analyte species M+ via electrospray ionisation. Trapped tagged ions, M+•Tag, are irradiated by infrared photons. In case of resonant absorption, some of the ions in the population dissociate via loss of the tag, which is verified in the mass spectrum. By monitoring the photodissociation yield as a function of infrared frequency, the infrared “action” spectrum can be obtained.
The role of the tag in Figure 1 is to report on photodissociation. Ideally, the tag does not distort the infrared spectrum of the molecule M+ too much. Solvent tags, such as acetonitrile have rather strong binding, and therefore affect the infrared spectrum. More “innocent” tags, such as N2, are much more weakly bound, and thus distort the infrared spectrum far less. Due to the low binding energy, ions must be cooled to low temperatures to generate M+•N2 complexes. This can be achieved in cryogenic traps, which can be cooled down below 30 K.
Infrared ion spectroscopy is well placed to address current limitations in analytical mass spectrometry of small molecules, notably in metabolomics and drug analysis. In both of these areas of research, current methodologies do not allow identification of true unknowns, as the identification is limited to mass spectral databases of known compounds. As is well known from Fourier transform infrared (FT-IR) spectral databases, molecules with similar structures also have similar infrared spectra. This correlation is the key premise for the power of infrared ion spectroscopy in the structural characterisation of unknowns.
Cryogenic infrared spectroscopy
The chemical specificity of spectroscopic measurements depends on the spectroscopic resolution. In gas-phase spectroscopy, resolution is maximised in low-temperature experiments. In mass spectrometry-based instrumentation, it is possible to cool ions down in cryogenic traps. Figure 2 contrasts infrared “action” spectra of the amino acid tryptophan, recorded at room temperature and at cryogenic temperature. It is clear that the cryogenic spectrum is much more information rich, as there are many more spectral features that can be distinguished. The differences in the infrared spectra are not merely due to differences in the temperatures of the ions, the spectroscopic schemes also differ. In room-temperature spectroscopy, covalent bonds must be broken. This requires absorption of multiple photons, which lead to band shifting and broadening. In the cryogenic spectroscopy scheme, the van der Waals N2-tagged ion dissociates upon absorption of a single photon. The fact that a single photon is sufficient to induce photodissociation has additional advantages: 1) one returns to a linear spectroscopy regime, where photodissociation yields can directly be compared to absorption cross sections and 2) the required photon fluence is lower, meaning that benchtop light sources can cover the entire spectral range (550–4000 cm–1), as opposed to expensive free electron lasers. One caveat with cryogenic experiments is the observation of multiple conformers. In Figure 2, some of the bands are associated with two different conformers, A and B.1,2 The relative intensities of these bands will depend on the relative presence of either conformer, which may differ based on experimental conditions in the cryogenic trap.
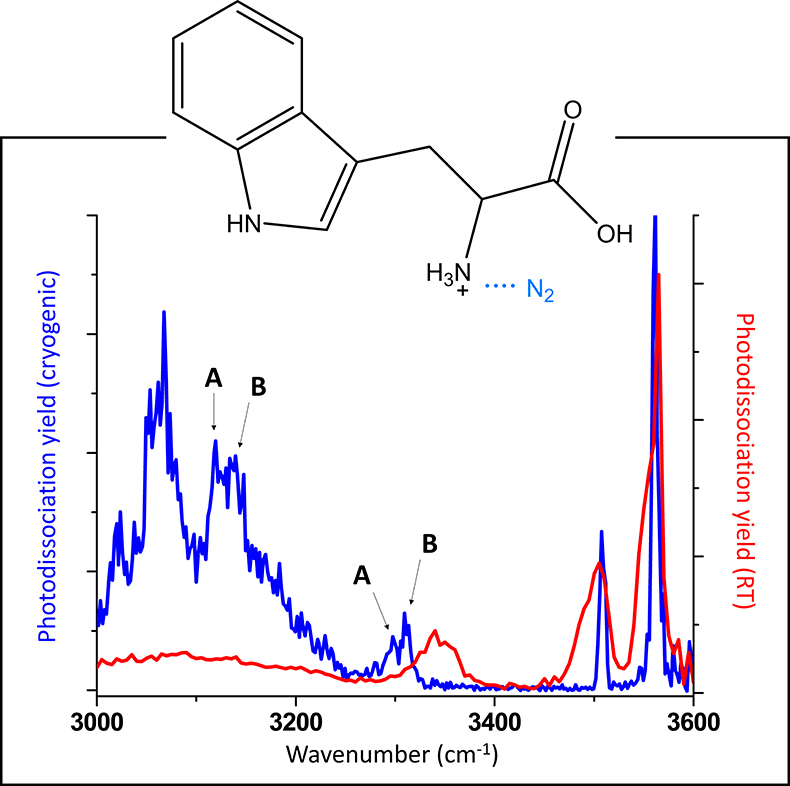
Figure 2. Comparison of infrared “action” spectra of protonated tryptophan recorded at room temperature and at cryogenic temperature. Some of the bands in the cryogenic infrared spectrum are tentatively assigned to different conformations (A and B).
Tuneable light sources
The fact that infrared spectra can now be recorded with benchtop light sources means that these measurements are accessible to individual investigator laboratories, as opposed to free electron laser user facilities. Currently, the state-of-the-art benchtop light sources for infrared “action” spectroscopy are optical parametric oscillators/amplifiers. These light sources are based on non-linear crystals (e.g. KTiOPO4), where a pump photon, usually a 1064 nm Nd:YAG photon, is ultimately converted into a tuneable infrared output between 2000 cm–1 and 4400 cm–1. Addition of another non-linear crystal (e.g. AgGaSe2) can extend this output down to 550 cm–1.
Nonetheless, the operation of non-linear optics-based light sources requires experience, and this imposes some challenges for making the technique widely available. The continuous development of turnkey semi-conductor light sources, such as quantum cascade lasers, could change this picture in the mid to long term.
Mass spectrometry instrumentation
The largest impediment to making cryogenic infrared spectroscopy a routine tool in bioanalytical mass spectrometry is the unavailability of commercial cryogenic traps. All instruments to date have been custom built. Proof-of-principle experiments have shown that high-quality data can be recorded, but little emphasis has been placed on maximising sensitivity for “real” sample analysis, nor on optimising the duty cycle of the experiment. The requirement of scanning the infrared frequency makes infrared spectroscopy an inherently slow technique. It typically takes tens of minutes to record an infrared spectrum. This is further compounded by the fact that generally only one analyte is probed at a time. This makes infrared ion spectroscopy a very low throughput technique. A potential remedy to the duty cycle problem lies in the predictable photodissociation of tagged ions, involving the loss of the tag. Because tagging and detagging occurs via a known mass change (i.e., DM = mass of tag, see Figure 1), the infrared spectra of a number of tagged analytes can be measured in parallel in a multiplexed approach, as long as their masses do not overlap. This has already been demonstrated in proof-of-principle experiments.1
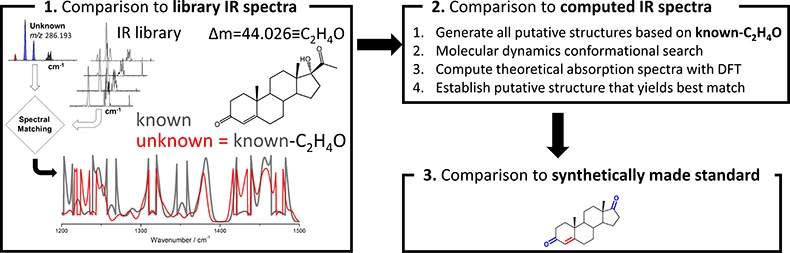
Figure 3. Workflow for chemical characterisation of unknown analytes based on accurate mass measurement and experimental cryogenic infrared spectrum
Interpreting infrared spectra
Now that high-quality cryogenic infrared spectra on low-concentration samples (i.e., nM) can be recorded in a reasonable time (<30 min), the remaining question that needs to be addressed is how an infrared spectrum of an unknown can lead to identification. Figure 3 illustrates the basic strategy for characterising analytes with unknown structures. A key component involves the comparison of the infrared spectrum of the unknown with previously catalogued infrared spectra of standards to determine which known molecule it is most similar to; this, of course, presumes that infrared spectral similarities correlate strongly with structural similarities. Especially the fingerprint region (1200–1500 cm–1) is anticipated to be a powerful probe in this respect. The accurate mass measurement of the unknown would be expected to yield the elemental composition, which in combination with the spectral matching could then be used to generate putative candidate structures. With an infrared library that is well represented in various chemical classes of molecules, such an approach would be expected to give a good guess on what the unknown may be. Further refinements are possible via computational approaches. Computational chemistry involving molecular dynamics and density functional theory yields the theoretical infrared spectra of putative candidate molecules which can be compared to the experimental spectrum. Thus, computational approaches can be used to rank the candidate structures from most to least probable. An ultimate identification will require synthesis of the putative candidate and match with the experiment.
Conclusions
In summary, the high information content of cryogenic infrared spectra of ions has the potential to make the technique the gold standard for molecular identification of small molecules in mass spectrometry.3 The relatively long measurement times (i.e., minutes to an hour) would likely make this a high-end method for off-line analysis of samples where conventional approaches have failed. Over the coming years, the technique is anticipated to make an impact in small molecule analysis, such as metabolites, drugs and classes of molecules containing many isomers (e.g. saccharides), as already demonstrated in a number of proof-of-principle studies.1,4–7
References
- A.P. Cismesia, M.R. Bell, L.F. Tesler, M. Alves and N.C. Polfer, “Infrared ion spectroscopy: an analytical tool for the study of metabolites”, Analyst 143, 1615 (2018). doi: https://doi.org/10.1039/c8an00087e
- A.Y. Pereverzerv, X. Cheng, N.S. Nagornova, D.L. Reese, R.P. Steele and O.V. Boyarkin, “Vibrational signatures of conformer-specific intramolecular interactions in protonated tryptophan, J. Phys. Chem. A 120, 5598 (2016). doi: https://doi.org/10.1021/acs.jpca.6b05605
- A.P. Cismesia, L.S. Bailey, M.R. Bell, L.F. Tesler and N.C. Polfer, “Making mass spectrometry see the light: the promises and challenges of cryogenic infrared ion spectroscopy as a bioanalytical tool”, J. Am. Soc. Mass Spectrom. 27, 757 (2016). doi: https://doi.org/10.1007/s13361-016-1366-4
- J. Martens, V. Koppens, G. Berden, F. Cuyckens and J. Oomens, “Combined liquid chromatography-infrared ion spectroscopy for identification of regiomeric drug metabolites”, Anal. Chem. 89, 4359 (2017). doi: https://doi.org/10.1021/acs.analchem.7b00577
- O. Gorlova, S.M. Colvin, A. Brathwaite, F.S. Menges, S.M. Craig, S.J. Miller and M.A. Johnson, “Identification and partial structural characterization of mass isolated valsartan and its metabolite with messenger tagging vibrational spectroscopy”, J. Am. Soc. Mass Spectrom. 28, 2414 (2017). doi: https://doi.org/10.1007/s13361-017-1767-z
- B. Schindler, L. Barnes, G. Renois, C. Gray, S. Chambert, S. Fort, S. Flitsch, C. Loison, A.R. Allouche and I. Compagnon, “Anomeric memory of the glycosidic bond upon fragmentation and its consequences for carbohydrate sequencing”, Nature Commun. 8, 973 (2017). doi: https://doi.org/10.1038/s41467-017-01179-y
- C. Masellis, N. Khanal, M.Z. Kamrath, D.E. Clemmer and T.R. Rizzo, “Cryogenic vibrational spectroscopy provides unique fingerprints for glycan identification”, J. Am. Soc. Mass Spectrom. 28, 2217 (2017). doi: https://doi.org/10.1007/s13361-017-1728-6