Patrick Garidel, Anne R. Karow and Michaela Blech
Boehringer Ingelheim Pharma GmbH & Co. KG, Biopharmaceuticals, Protein Science, Biberach an der Riss, Germany. E-mail: [email protected]
Introduction
Drug discovery is a very time demanding, laborious and cost intensive process marred by multiple risks with high attrition rates. In order to better balance the different risks (e.g. biological activity, binding properties, efficacy and safety, pharmacokinetics) encountered during the early development phase, approaches using different developability risk assessments were introduced into the pharmaceutical industry. These assessments should allow for increasing and improving the correct selection and design of products with the right quality attributes. From the CMC perspective (CMC: Chemistry, Manufacturing and Controls) of biologics, besides the fermentation titer and purification yield, the stability of the protein during the development phase is one of the most crucial quality attributes, because it directly contributes to the cost of goods, and also to the overall safety of the product. In addition to the stability of the drug product, the developed proteins have to show a specific stability during fermentation and/or downstream processing.
However, the term stability has to be specified, because it is often unclear which stability issue is being considered. The term stability summarises a number of stability attributes such as biological stability (e.g. stability in the presence of enzymes, proteases), physical and colloidal stability (conformational stability, cold denaturation, surface/interface induced denaturation, precipitation, shear induced denaturation, aggregation and particle formation) or chemical stability (e.g. deamidation, fragmentation, oxidation, glycation, disulfide scrambling).1
In the early development phase, only a very limited number of stability parameters can be considered due to a large lack of material as well as time. Besides chemical-induced stability assays, in most cases temperature is used as the perturbation parameter to select stability properties of therapeutic protein candidates.
For example, using differential scanning calorimetry (DSC), the thermal- induced unfolding and denaturation properties of a protein solution are monitored and the corresponding heat capacity curve is registered. Spectroscopic assays based on mid-infrared spectroscopy or circular dichroism (CD) monitor the change in the secondary protein structure as a function of perturbation (e.g. temperature).2,3
Various fluorescence assays (extrinsic and intrinsic fluorescence) can also be used.4 Using an extrinsic fluorescence assay, i.e., using an external fluorescence dye that is added to the protein solution, conformational changes are monitored by probing the fluorescence dye–protein interaction. The advantage of using an extrinsic fluorescence assay is the high sensitivity towards conformational changes of the protein as well as the low material demand (< µg/experiment).5 However, one has to be aware that the addition of the fluorescence dye and its presence may directly perturb protein conformation and induce a shift in the conformational equilibrium. This issue is discussed intensively in the published literature.4,5 To avoid the influence of an extrinsic dye, one can rely on an intrinsic fluorescence assay, monitoring changes in the tryptophan, tyrosine or phenylalanine environment of proteins due to a conformational perturbation.6 For an intrinsic tryptophan fluorescence (ITF) assay, the protein consumption is in the µg range per experiment.7
All the above described assays have technical limitations and vary in their sensitivity and, most important and often not reflected, various physical observables are monitored and have to be considered. This means that the outcome of the experiments do not necessarily match, because different “denaturation/unfolding” processes are registered.8
For example, ITF is useless for probing the conformation of a protein candidate that bears no tryptophan amino acid, or DSC becomes inadequate for monitoring the unfolding of proteins with reduced secondary structural changes.
In this article, we focus on the use of two orthogonal techniques to monitor two different “stability” aspects, namely conformational changes as well as aggregation propensity of therapeutic protein candidates. Thermal-induced conformational changes and unfolding is monitored by ITF, whereas thermal-induced aggregation is monitored via right angle light scattering (RALS). These methods and the derived corresponding parameters probe two different, orthogonal stability aspects. In the presented assays, both parameters are monitored simultaneously for the same sample. The perturbation parameter in this case is temperature.
Experimental
Materials
The used glycoproteins were produced by mammalian cell culture technology, whereas the non-glycosylated proteins were obtained by Escherichia coli cell culture technology.9 All proteins were recovered, purified and characterised according to procedures described in the literature.10,11 Protein monomer content was > 99% (based on high performance size exclusion chromatography).
Intrinsic tryptophan fluorescence
ITF experiments were performed with the same equipment as described previously.8 In brief, the tryptophan emission spectra of the investigated proteins are recorded from 310 nm to 390 nm upon excitation at 295 nm using a defined thermal screening profile from 20°C to 90°C. After smoothing the raw spectra (seven-point Savitzky–Golay algorithm), the position of the peak maxima, expressed as the ratio of emission intensity at 350 nm to that at 330 nm, (I350/I330) is plotted as a function of temperature (see Figure 1A). The resulting data were smoothed and transition/unfolding temperatures were obtained from their second derivatives. The transition temperature(s) describes the temperature(s) at which a change in the tryptophan environment occurs as a consequence of temperature increase, and thus protein conformational changes and unfolding is observed (Tunfold.).
Right angle light scattering
RALS stability screening is performed on a high sensitivity fluorescence spectrometer (e.g. PTI, Photon Technology International QuantaMaster, NJ, USA or Aminco-Bowman® Series 2 Luminescence Spectrometer, Thermo Electron Corporation, WI, USA) equipped with a purpose-manufactured Peltier-controlled multi-sample holder.12 Excitation is performed at λExc = 320 nm and emission recorded at λEm = 320 nm. Protein concentration is in the range of 0.1 mg mL-1; sample volume approximately 10 µL. Aggregation temperature (Tagg) is defined as the temperature inducing a strong intensity increase in scattering signal (see Figure 1B) and can be monitored within an accuracy of ± 0.5 K. The Figure 1B example shows the reproducibility of two RALS experiments for the same protein solution.
Results
Using ITF for assessing tryptophan-containing proteins, the sample is excited between λ = 295 nm and 305 nm, such that fluorescence is mostly emitted selectively from tryptophan and the contribution from the other two intrinsic fluorophores, tyrosine and phenylalanine can be neglected. The physical reason for monitoring a conformational change using the ITF assay is due to a change of the emission maximum of tryptophan as a function of the polarity environment of the amino acid tryptophan. This polarity change is induced by a conformational change which can be triggered using a thermal shift assay (see, for example, Figure 1A).

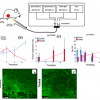
Figure 1. Monitoring two different “stability” aspects. (A) Conformational changes upon thermal-induced unfolding (Tunfold.). Normalised ITF fluorescence intensity of a protein solution at 0.1 mg mL–1 at 25°C (▲[orange]) and 90°C (▼[red]). (B) RALS temperature profile for the evaluation of the thermally-induced aggregation temperature (Tagg) of a protein demonstrating the reproducibility of the assay. For both assays, identical experimental conditions (20 mM phosphate buffer pH 7.0, 130 mM NaCl) were used. 1st sample (●), 2nd sample (○). (A.U., arbitrary unit).
Figure 1A exemplifies the impact of temperature on the ITF fluorescence spectrum. For tryptophan molecules in a more or less apolar environment the fluorescence maximum is in the range of λ = 330 nm and at increasing exposure to an aqueous environment the intensity component at ca 350 nm increases. Therefore the intensity ratio I350/I330 is used to monitor conformational changes and/or unfolding of the protein structure. For a protein candidate that bears just a single tryptophan, changes in the corresponding part/domain of the molecule are selectively observed, whereas no information on conformational changes of the rest of the molecule structure is obtained. For multi-tryptophan molecules the interpretation of the ITF data becomes more challenging, however, allowing one to gain a broader view of the overall conformational change.

Figure 2. Screening the thermal stability of two different therapeutic proteins (P1 and P2) in the same formulation (20 mM histidine pH 6.5; 300 mOsmol kg–1). The ITF profile of P1 shows one transition (Tunfold. 70°C), whereas P2 exhibits two transitions (Tunfold. 38°C and 60°C). RALS observed in both cases only one event indicated by the onset aggregation temperature. In both cases Tagg > Tunfold. Analysis of the fluorescence observables ITF at intensity ratio I350/I330 (Tunfold.) and RALS at 320 nm (Tagg)
Figure 2 shows two examples of a thermal-induced unfolding of two different therapeutic candidates. The ITF profile of protein 1 (P1) shows one transition, induced by conformational changes/unfolding, that is defined at an unfolding onset temperature (Tunfold.) of ca 70°C, whereas the ITF profile of protein 2 (P2) looks different. Two transitions are observed with their unfolding onset temperatures at 38°C and 60°C.
Simultaneously the aggregation process of the two candidates is registered via RALS. In both cases only one event is observed. The onset aggregation temperature (Tagg) for P1 is 78°C and for P2 67.5°C. In both cases Tagg > Tunfold.
Furthermore, in the case of P2 we investigated that the first transition event is reversible, when the sample is not heated above 55°C. This was confirmed using DSC (data not shown). However, aggregation of P2 is observed when the sample is heated significantly above the first ITF transition.
This assay can generally be used for the thermal-induced ITF conformational and RALS aggregation assessment of various candidates.

Figure 3. Evaluation of temperature profiles for the unfolding (ITF, Tunfold.) and aggregation (RALS, Tagg) propensity of two different sets containing various therapeutic candidates (A) and (B) formulated in the same solution conditions (25 mM buffer pH 6.0; 300 mOsmol kg–1). (A) Candidate 6 exhibits the highest conformational stability (Tunfold.). RALS (Tagg) follows the tendency of conformational stability, and thus T<sub>agg</sub> > Tunfold.. In contrast, (B) depicts candidates with similar Tunfold. allowing for them only to be discriminated based on their RALS data.
Figure 3A shows Tagg (RALS) and Tunfold. (ITF) for six candidates formulated in the same solution. For the presented examples, just one ITF transition was observed. For Candidate 1 Tunfold. (ITF) is 65.3°C, whereas for Candidate 6 Tunfold. (ITF) is located at 75.8°C. This shows that based on the ITF assay, Candidate 6 exhibits the structure with the highest conformational stability. Analysing the RALS results for the six candidates it is obvious that the thermal-induced aggregation onset matches with the conformational stability of the six candidates. The candidate with the lowest conformational stability as assessed by ITF also has the highest aggregation tendency (corresponds to the lowest Tagg). For the six investigated candidates Tagg > Tunfold.. For the selected candidates and based on the results of two stability indicating assays, Candidate 6 has the most appropriate CMC developability propensity.
However, the evaluation is not always straightforward. Figure 3B illustrates five additional candidates analysed by the same orthogonal assays. Tunfold. of the five candidates is rather similar with temperatures in the range of 68– 69.5°C. Based on the thermal-induced conformational ITF assay the five candidates are more or less equivalent. Analysing the RALS (Tagg) data, one can discriminate between the candidates. The highest Tagg values are observed for Candidates 4 and 5 (Figure 3B). A more careful investigation of the data for these two candidates shows that Candidate 5 has the highest Tagg, whereas Candidate 4 shows the highest Tunfold.. Based on the used orthogonal assay approach, Candidates 1–3 can be discarded and classified as “least stable”. In order for correct evaluation and selection of the most appropriate candidate, other developability parameters such as binding, efficacy/activity/functionality etc., have to be considered. However, focusing on an assay that only monitors the thermal- induced conformational changes would not help to discriminate between and select the appropriate candidates.
Tunfold. and Tagg for a protein are also influenced by solution conditions. The presence of excipients, pH, ionic strength may alter the overall protein stability. The impact on pH of a candidate is shown in Figure 4A. This candidate exhibits two ITF transitions that depend on the solution pH. One ITF transition is observed below 50°C, the other ITF transition is observed at ca 70°C.

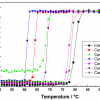
Figure 4. Thermal stability of two therapeutic candidates (A) and (B) formulated in different pH in the same basic solution. (A) This candidate exhibits two ITF transitions. ITF1 is strongly influenced by the pH, whereas ITF2 features only minor destabilisation of its folded conformation. In this case, RALS is to a lower extent influenced by pH. (B) This candidate exhibits only one ITF transition (Tunfold.), which increases from pH 3.5 to 8. In contrast, RALS data (Tagg) depict a complete opposite trend. With increasing pH Tagg drops significantly. Tagg < Tunfold.
According to the results presented in Figure 4A, acidic pH conditions destabilise the folded conformation of the protein. With increasing pH from 3.5 to 8, Tunfold. increases. This is especially observed for the first ITF unfolding. For the pH range above pH 6.5, the thermal-induced conformation is not influenced by the solution pH. The first ITF unfolding event is significantly influenced by the pH, however, with a tendency of Tunfold. decreasing. The RALS Tagg is to a lesser extent influenced by pH, with a tendency for the protein becoming more stable at acidic pH conditions.
Figure 4B shows a second example. In this case, the corresponding protein exhibits only one ITF transition Tunfold. which increases from pH 3.5 to pH 8. Based on that, the most appropriate and thus stabilising pH conditions would be above pH 5. However, the analysis of the RALS Tagg data depicts a completely opposite trend. With increasing pH Tagg drops strongly from 55°C to 38°C. This example also demonstrates that this candidate is very sensitive to protein aggregation with Tagg < Tunfold..
These last two examples illustrate that at least two orthogonal methods are needed to correctly judge and select the appropriate candidate and solution condition. Thus, the challenge is to choose the appropriate assays.
Conclusions
In the early development phase the correct choice of suitable stability screening assays and with this the appropriate developability attributes is crucial for the correct assessment of therapeutic protein candidates. Focusing only on an unfolding assay is certainly not sufficient. One has to consider an orthogonal assay, which means the assays are ones that rely on different physical observables. The current approach allows for the simultaneous monitoring of two “independent” observables (Tunfold. and Tagg) with a very low protein consumption (ca 1 µg per experiment) using ITF and RALS. Furthermore, by assessing the stability pH profile of different therapeutic protein candidates one has to balance the different stability aspects and not only rely on one stability indicating parameter.
Acknowledgements
Heidrun Schott, Andrea Eiperle and Michael Weichel are acknowledged for their excellent technical assistance and Ingo Presser for critical reading of the manuscript.
References
- P. Garidel and S. Bassarab, “Impact of formulation design on stability and quality”, in Quality for Biologics: Critical Quality attributes, Process and Change Control, Production Variation, Characterisation, Impurities and Regulatory Concerns, Ed by N. Lyscon. Biopharm Knowledge Publishing, Ch. 7, pp. 94–113 (2008).
- J.M. Chalmers and P.R. Griffiths (eds), Handbook of Vibrational Spectroscopy, Volume 3 Sample Characterization and Spectral Data Processing. John Wiley & Sons Ltd, Chichester (2002).
- P. Garidel and H. Schott, “Fourier-transform midinfrared spectroscopy for the analysis and screening of liquid protein formulations. Part 2: Detailed analysis and applications”, BioProcess Int. 4(6), 48–55 (2006).
- W. Jiskoot, A.J.W.G. Visser, J.N. Herron and M. Sutter, “Fluorescence spectroscopy”, in Methods for Structural Analysis, Ed by W. Jiskoot and D. Crommelin. AAPS Press, Ch. 2, pp. 27–82 (2005).
- B. Demeule, R. Gurny and T. Arvinte, “Detection and characterisation of protein aggregates by fluorescence microscopy”, Int. J. Pharmaceut. 329, 37–45 (2007). doi: http://dx.doi.org/10.1016/j.ijpharm.2006.08.024
- M. Weichel, S. Bassarab and P. Garidel, “Probing the thermal stability of MAbs by intrinsic tryptophan fluorescence. A practical approach for protein preformulation development”, BioProcess Int. 6(6), 42–52 (2008).
- P. Garidel, M. Hegyi, S. Bassarab and M. Weichel, “A rapid, sensitive and economical assessment of monoclonal antibody conformational stability by intrinsic tryptophan fluorescence spectroscopy”, Biotechnol. J. 3, 1201–1211 (2008). doi: http://dx.doi.org/10.1002/biot.200800091
- P. Garidel, “Steady-state intrinsic tryptophan protein fluorescence spectroscopy in pharmaceutical biotechnology”, Spectrosc. Europe 20(4), 7–11 (2008). http://bit.ly/1qObQce
- K. Bergemann, C. Eckermann, P. Garidel, S. Grammatikos, A. Jacobi, H. Kaufmann, R. Kempken and S. Pisch-Heberle, “Production and downstream processing”, in Handbook of Therapeutic Antibodies, 1st Edn, Ed by S. Dübel. Wiley-VCH, Weinheim, Volume I: Technologies, Ch. 9, pp. 199–238 (2007).
- A. Jacobi, B. Ennkel, P. Garidel, C. Eckermann, M. Knappenberger, I. Presser and H. Kaufmann, “Process development and manufacturing of therapeutic antibodies”, in Handbook of Therapeutic Antibodies, 2nd Edn. Ed by S. Dübel and J.M. Reichert. Wiley-VCH, Weinheim, Ch. 22, pp. 1–61 (2014).
- P. Garidel, W. Kliche, S. Pisch-Heberle and M. Thierolf, “Characterization of proteins and related analytical techniques”, in Protein Pharmaceuticals—Formulation, Analytics & Delivery, Ed by H.C. Mahler, G. Borchard and H. Lueßen. Editio Cantor Verlag, Aulendorf. Ch. 2, pp. 44–89 (2010).
- P. Garidel, “Right angle light scattering protein thermostability screening: from research to development“, Spectrosc. Europe 24(1), 13–18 (2012). http://bit.ly/1rmC