
 Schematic of the measurement system developed in this study. By using this technology, extraction and ionisation of pL volumes can be performed without disruptions caused by surface roughness. In addition, one can measure the height of the sample from the change in vibration amplitude. (b) Relationship between the length of the capillary probe and the resonance frequency of the probe. (c) Correlation between the input voltage to the piezoelectric actuator used to vibrate the probe and the probe vibration amplitude. (d) Correlation between the height of the sample and the feedback control signal. Credit: Reproduced with permission. Copyright 2021 American Chemical Society. https://doi.org/10.1021/acs.analchem.0c04144")
Medical professionals all want to be able to quickly and correctly diagnose diseases. Their future ability to do so will depend on identifying what biochemicals are present in tissue sections, where the biomolecules are, and at what concentrations. For this purpose, mass spectrometry imaging (MSI) will be useful. However, the stability of biomolecular sampling needs improvement to obtain the chemical distribution information with high spatial resolution. In a recent study published in Analytical Chemistry, researchers from Osaka University used MSI to image the distribution of fat molecules in mouse brain tissue. They acquired data at a spatial resolution of 6.5 µm, enabling analysis on a cellular level.
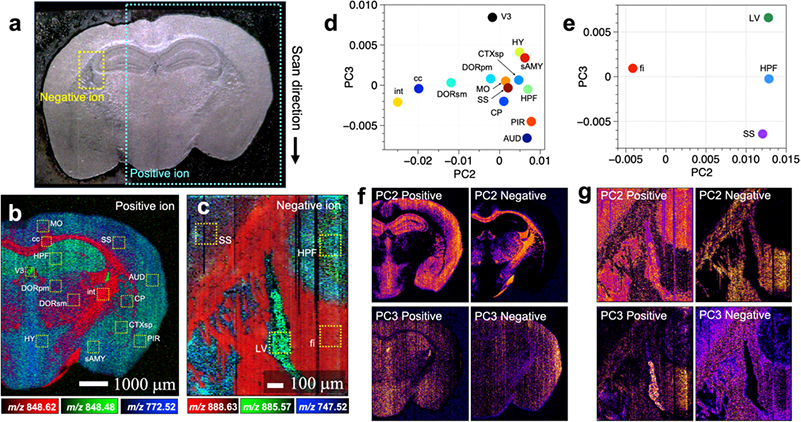
Figure 2. (a) Optical microscopy image of a mouse brain tissue section. (b,c) Mass spectrometry imaging of two regions of the optical microscopy image in positive- and negative ion modes, respectively. (d,e) Score plots obtained by principal component analysis of mass spectra included in the selected regions in (b) and (c), respectively. (f,g) Intra-tissue distribution of the score values of the second and third principal components obtained by principal component analysis. Feature images were obtained from differences in the structure of the brain tissue. Credit: Reproduced with permission. Copyright 2021 American Chemical Society. https://doi.org/10.1021/acs.analchem.0c04144
The researchers used a very small capillary to gently extract lipid molecules from a tissue section, and a carefully designed setup for fine 3D directional control. Although biological tissue may often seem smooth to the naked eye, on an ultrasmall scale it’s rather rough. The ability to account for this ultrasmall-scale roughness is central to obtaining reproducible biochemical data at high spatial resolution.
“In our experiments, the probe’s vibration amplitude is constant even when the sample height changes”, says Yoichi Otsuka, first author. “We can also measure changes in sample height up to 20 µm, and it can be increased up to 180 µm.”
The researchers’ first experiments were to measure irregular distributions of molecules across an uneven surface: microwells filled with various concentrations of a dye. The measured concentrations correlated with the known concentrations, and the measured surface topography was close to the actual microwell diameter. Experiments with mouse brain sections yielded a multi-dimensional data of multiple molecules such as the distribution of certain hexosylceramides—lipids that are important in aging.
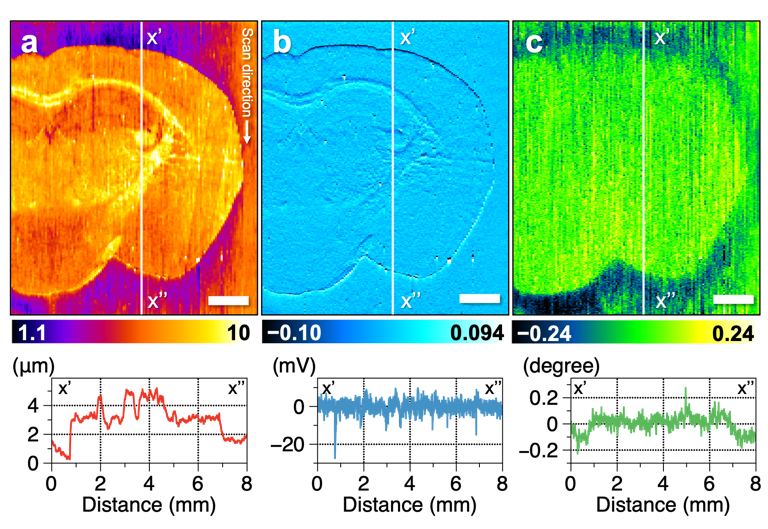
Figure 3. Results of multi-imaging of mouse brain tissue. Cross-sectional profiles of the vertical white line in the figure are shown below each image. (a) Topography showing the roughness of the sample surface. (b) Amplitude image showing the change in vibration amplitude of the probe, which is suppressed in uneven tissue. (c) Phase image showing the change in vibration phase of the probe. The oscillation phase of the probe differs between the brain tissue and glass substrate. Scale bar, 1 mm. Credit: Reproduced with permission. Copyright 2021 American Chemical Society. https://doi.org/10.1021/acs.analchem.0c04144
“Principal component analysis helped us integrate our wide-ranging data”, explains Takuya Matsumoto, senior author. “For example, we could assign the classes of lipids that are primarily present in the cortex and brainstem.”
Correlating such data with disease progression will require further study and perhaps additional development of the researchers’ biomolecule extraction setup. The researchers anticipate that their approach will be useful for quantitatively imaging the myriad neural networks in brain tissue. Ultimately, they hope to help medical practitioners reliably diagnose diseases such as brain cancer in a tissue section with the support of molecular information in high spatial resolution.


 and tower-based instruments (B and D) for control (blue) and drought (red) treatments. Credit: Christopher YS Wong et al. from University of California, Davis")
 and Leon Gläser (right) from the ZSW in Ulm together with WITec Application Scientist Dr Ievgeniia Iermak (middle) during training on the new Raman microscope.")